UI UX Case Study : Gordy Health

What is Gordy Health?

Gordy Health is a heart health technology and services company offering virtual cardiology care. Our mission is to save and improve lives through better heart care. We will first focus on lowering high blood pressure and treating hypertension for patients across the US.

Why Gordy Health?

Heart disease is the #1 cause of death in the US. Someone dies every 48 seconds from heart disease. Nearly half of U.S. adults have high blood pressure (BP), and only about 1 in 4 have it under control. High blood pressure leads to heart disease, stroke and kidney failure.
There are treatments (clinical care, medications, and lifestyle adjustments) to help control blood pressure, but many people do not use these treatments because traditional blood pressure management is hard to access, inconvenient, and confusing.
Essentially, we know what we can do to save lives, we just aren’t doing it. Gordy is setting out to change this.

Managing blood pressure at a large scale will require several product components:

  • At-home blood pressure monitoring
  • Telemedicine visits
  • Online pharmacy
  • Timely, accurate data flow between patients and their care team
  • Timely, effective communication between patients and their care team

Gordy Health will package our technology and services to manage high blood pressure and sell to the market through several different channels:

  • Physician practices that are primarily fee for service serving large Medicare populations
  • Physician practices, provider groups, and Accountable Care Organizations that are risk-bearing (acting like insurance companies)
  • Directly to consumers
  • Health insurers
Today, Gordy Health is serving patients by partnering with a 3rd party provider of Remote Patient Monitoring (RPM) technology and services. This partner manages device logistics (acquiring, storing, shipping, tracking blood pressure monitors) and provides a clinician and patient web application to access and track data from the BP monitors.
Gordy wishes to own and develop all the software needed for the complete Gordy Health offering and use a 3rd party provider only for device procurement and logistics.

Challenges

  • To Design & Build a Virtual Cardiology Application to Monitor Patients Blood Pressure
  • The customer is a heart health technology company offering virtual cardiology care. They focus on lowering high blood pressure and treating hypertension for patients across the US.
  • The customer wishes to own and develop a flexible, future-ready web application where clinicians log in and manage patients with high blood pressure or hypertension.
  • Needs software for the complete health offering and uses a 3rd party provider only for device procurement and logistics.
  • The application should be HIPPA(Vanta) & ADA compliant.

Deliverables

  • Project Documentation
  • Information architecture & User Flow
  • Design System
  • High Fidelity Wireframes
  • Interactive Prototype
  • Care Team Web App
  • Super Admin Web App

How did we design it?

As always, we followed human centered design process – Empathize, Define, Ideate, Prototype, Test
Gordy Designed

Competitors

By analyzing the competition, designers can gain insights into what is working and what is not, and identify potential opportunities and gaps in the market. Here are the list of competitors –
Competitors

SWOT Analysis

SWOT analysis allows us designers to identify the strengths and weaknesses of the company, as well its opportunities and threats from external competitors.
Strengths
Weakness
Opportunities
Threats

User Research Questions

  • How often do you use the remote monitoring device or application to track your symptoms?
  • How helpful is the data provided by the remote monitoring device or application in managing your health condition?
  • Can you describe the process of connecting the remote monitoring device to the application?
  • Have you experienced any technical issues while using the remote monitoring device or application?
  • How easy is it to understand the information displayed on the remote monitoring device or application?
  • Can you describe your experience with the user interface of the remote monitoring device or application?
  • How frequently do you receive notifications or alerts from the remote monitoring device or application?
  • How satisfied are you with the level of support provided by the remote monitoring device or application?
  • How would you rate the accuracy of the data collected by the remote monitoring device?
  • Can you describe a time when the remote monitoring device or application was not able to accurately track your symptoms?
  • How often do you share your health data with your healthcare provider through the remote monitoring device or application?
  • How would you describe the process of reviewing and interpreting the health data collected by the remote monitoring device or application?
  • How satisfied are you with the ability to communicate with your healthcare provider through the remote monitoring device or application?
  • How comfortable are you with the level of access your healthcare provider has to your health data through the remote monitoring device or application?
  • Can you describe your experience with the battery life of the remote monitoring device?
  • Have you experienced any issues with the physical design of the remote monitoring device?
  • Can you describe the process of replacing or upgrading the remote monitoring device?
  • How often do you receive updates or upgrades for the remote monitoring device or application?
  • How do you feel about the cost of the remote monitoring device or application compared to other similar solutions?
  • What features or improvements would you like to see in future versions of the remote monitoring device or application?

User Personas

Gordy User Personas

Customer Journey Mapping

Customer journey mapping is a process of visualizing and understanding a customer’s experience as they interact with a business or brand. It involves identifying each touchpoint a customer has with the business, understanding their needs and emotions, and using that information to improve the overall customer experience.
Customer Journey
Customer Journey

User Flow

By mapping out user intentions and desired outcomes from their experience, designers can create navigation systems which anticipate the needs of users and take them through the process as quickly and easily as possible.
Userflow

Solutions

  • Both the applications have a simple and intuitive interface that allows patient support team to easily navigate and use it
  • The app displays a personalized dashboard for each patient, showing their vital signs, medication reminders, and other important information in an easy-to-read format
  • The app provides real-time monitoring of the patient’s vital signs, such as heart rate and blood pressure levels
  • The app can be integrated with Gordy blood pressure cuff which provides continuous monitoring of the patient’s heart rate and BP reading
  • The app includes data analytics capabilities that allow healthcare providers to analyze and track patient data over time, and to make informed decisions about the patient’s care
  • The app is designed with strong security and privacy measures to protect patient data and maintain HIPAA compliance

Brand Guidelines

Brand guidelines create a unified voice for the company as well as help establish its identity and differentiate it from the competition. Carefully crafting, sustaining and maintaining these brand guidelines will ultimately keep a company competitive and successful.

Components

Components are reusable design elements that can be used to build interfaces. When you change a component, all instances of that component in your design will update automatically. This helps maintain consistency and reduces time and effort spent on manual updates.
Gordy

Final Screens (Super Admin)

Final Screens (Tenant App)

Platform Success Factors

onboarding

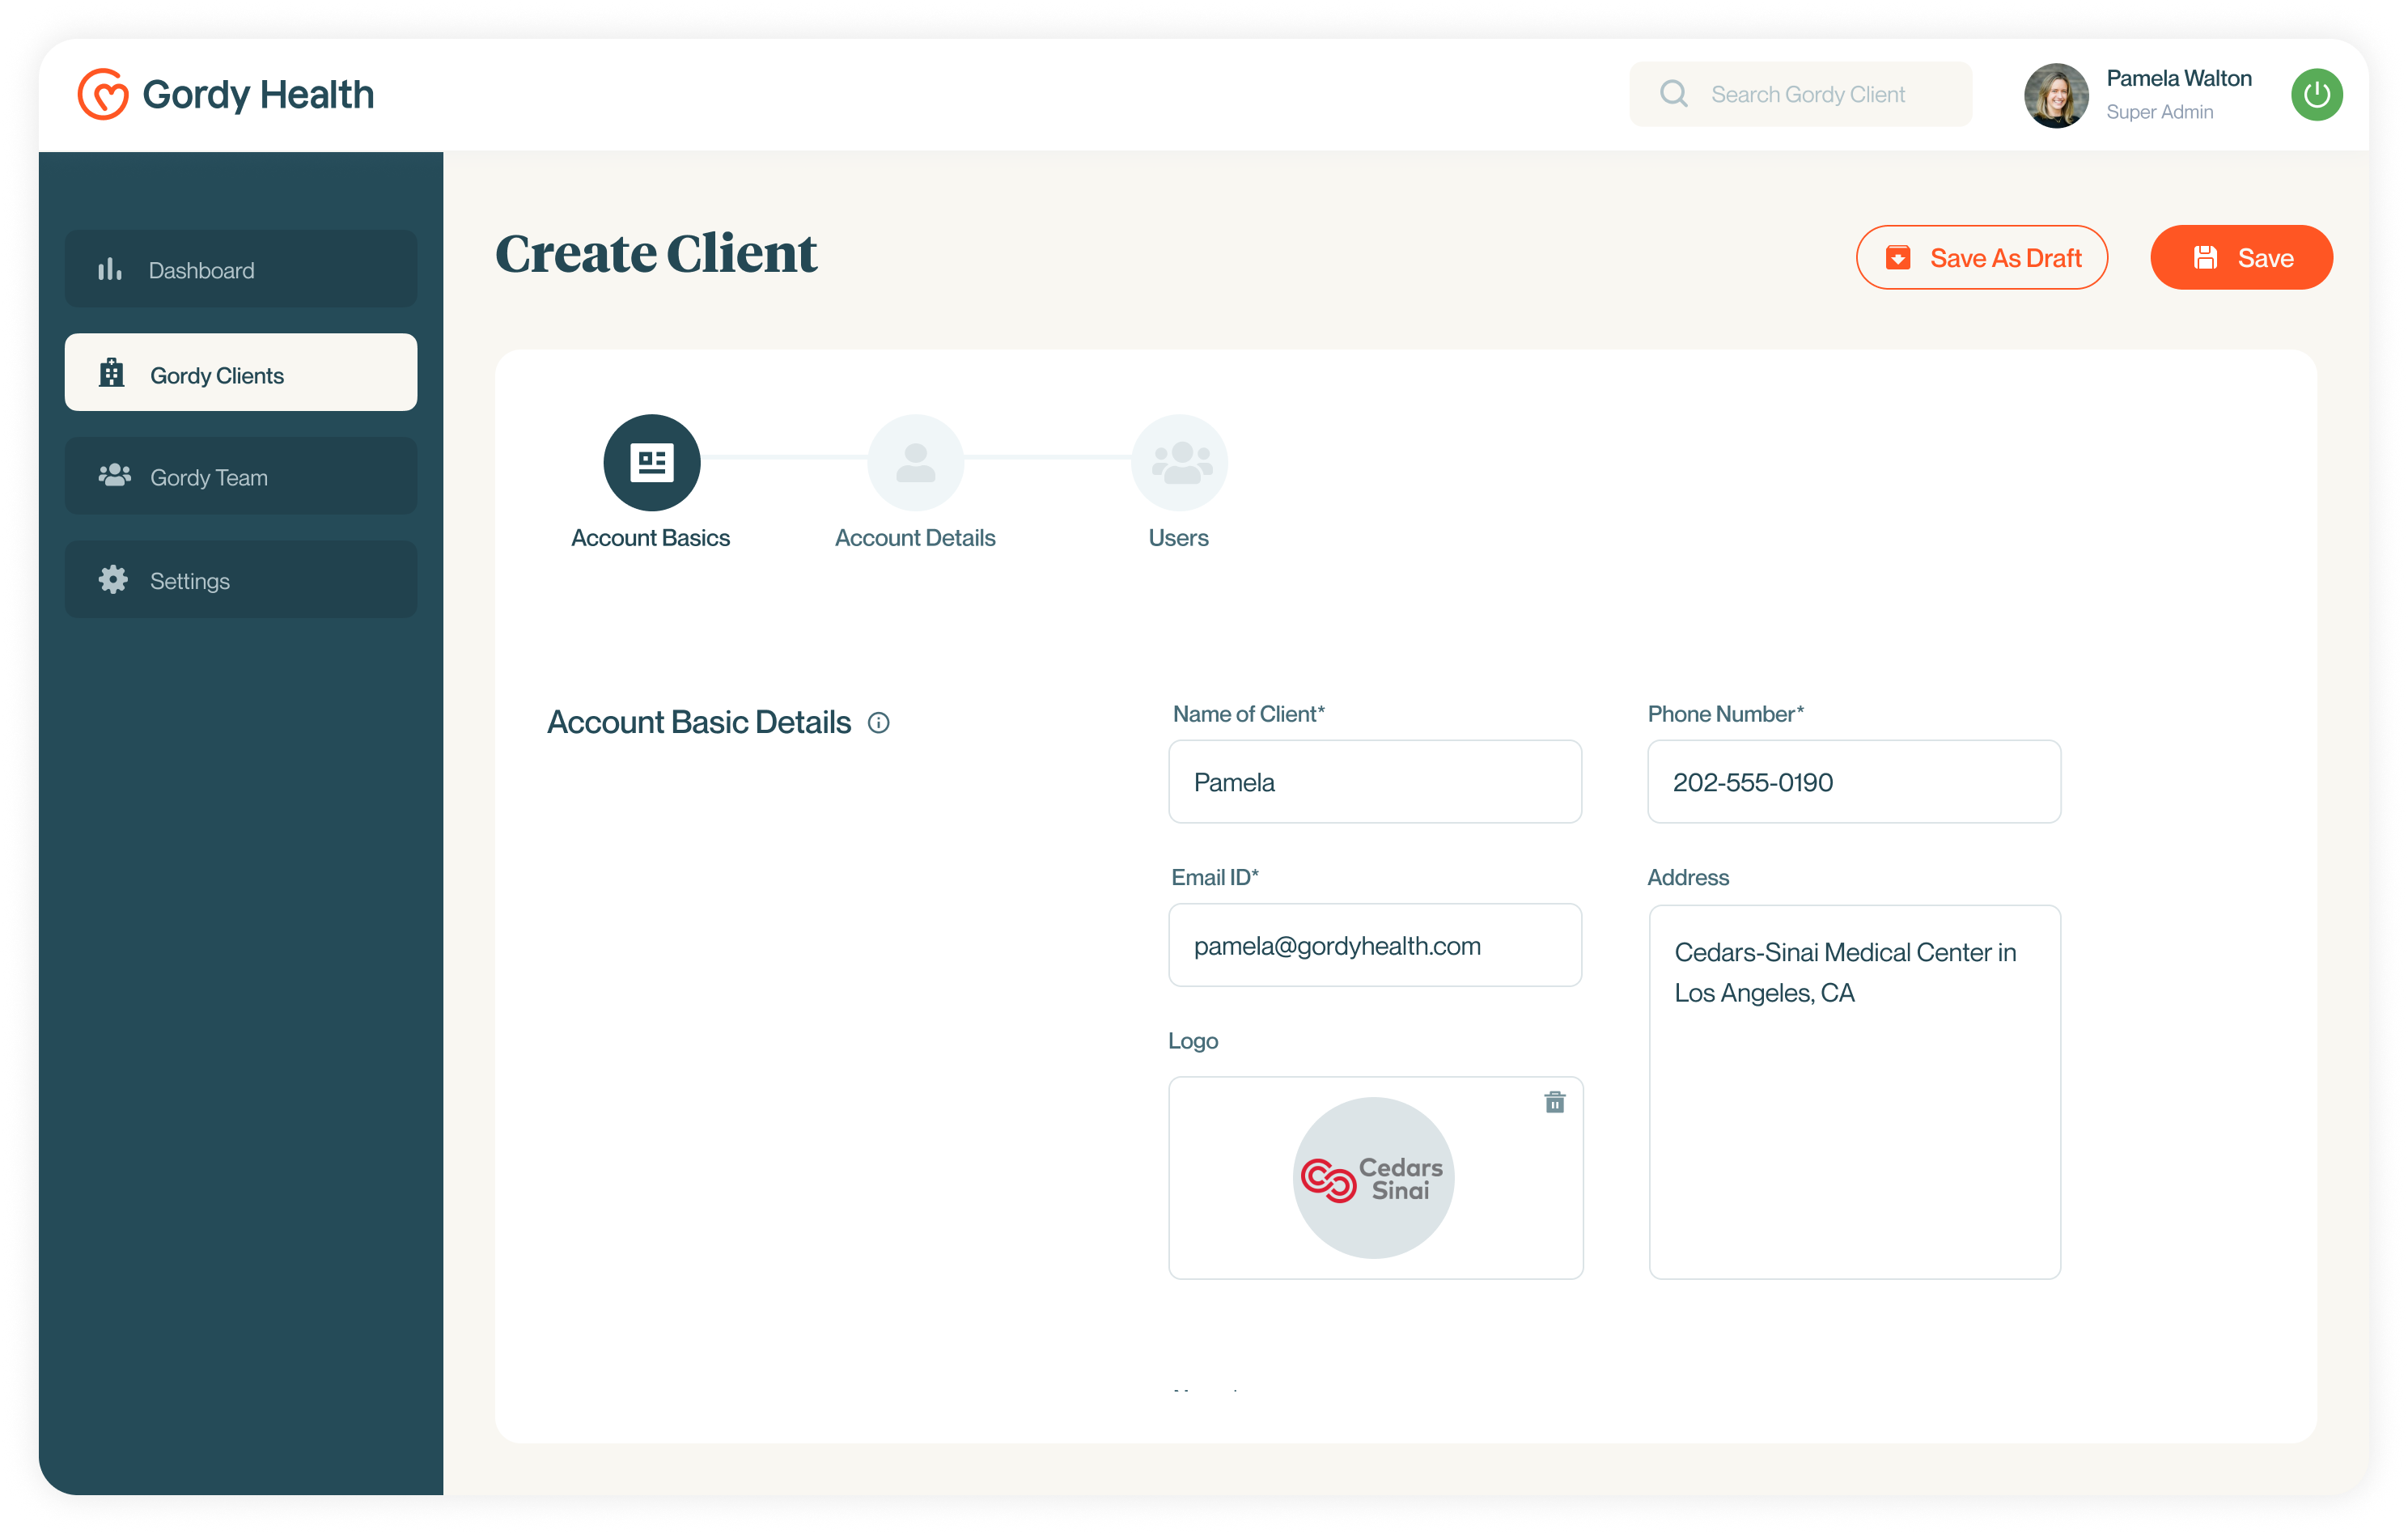
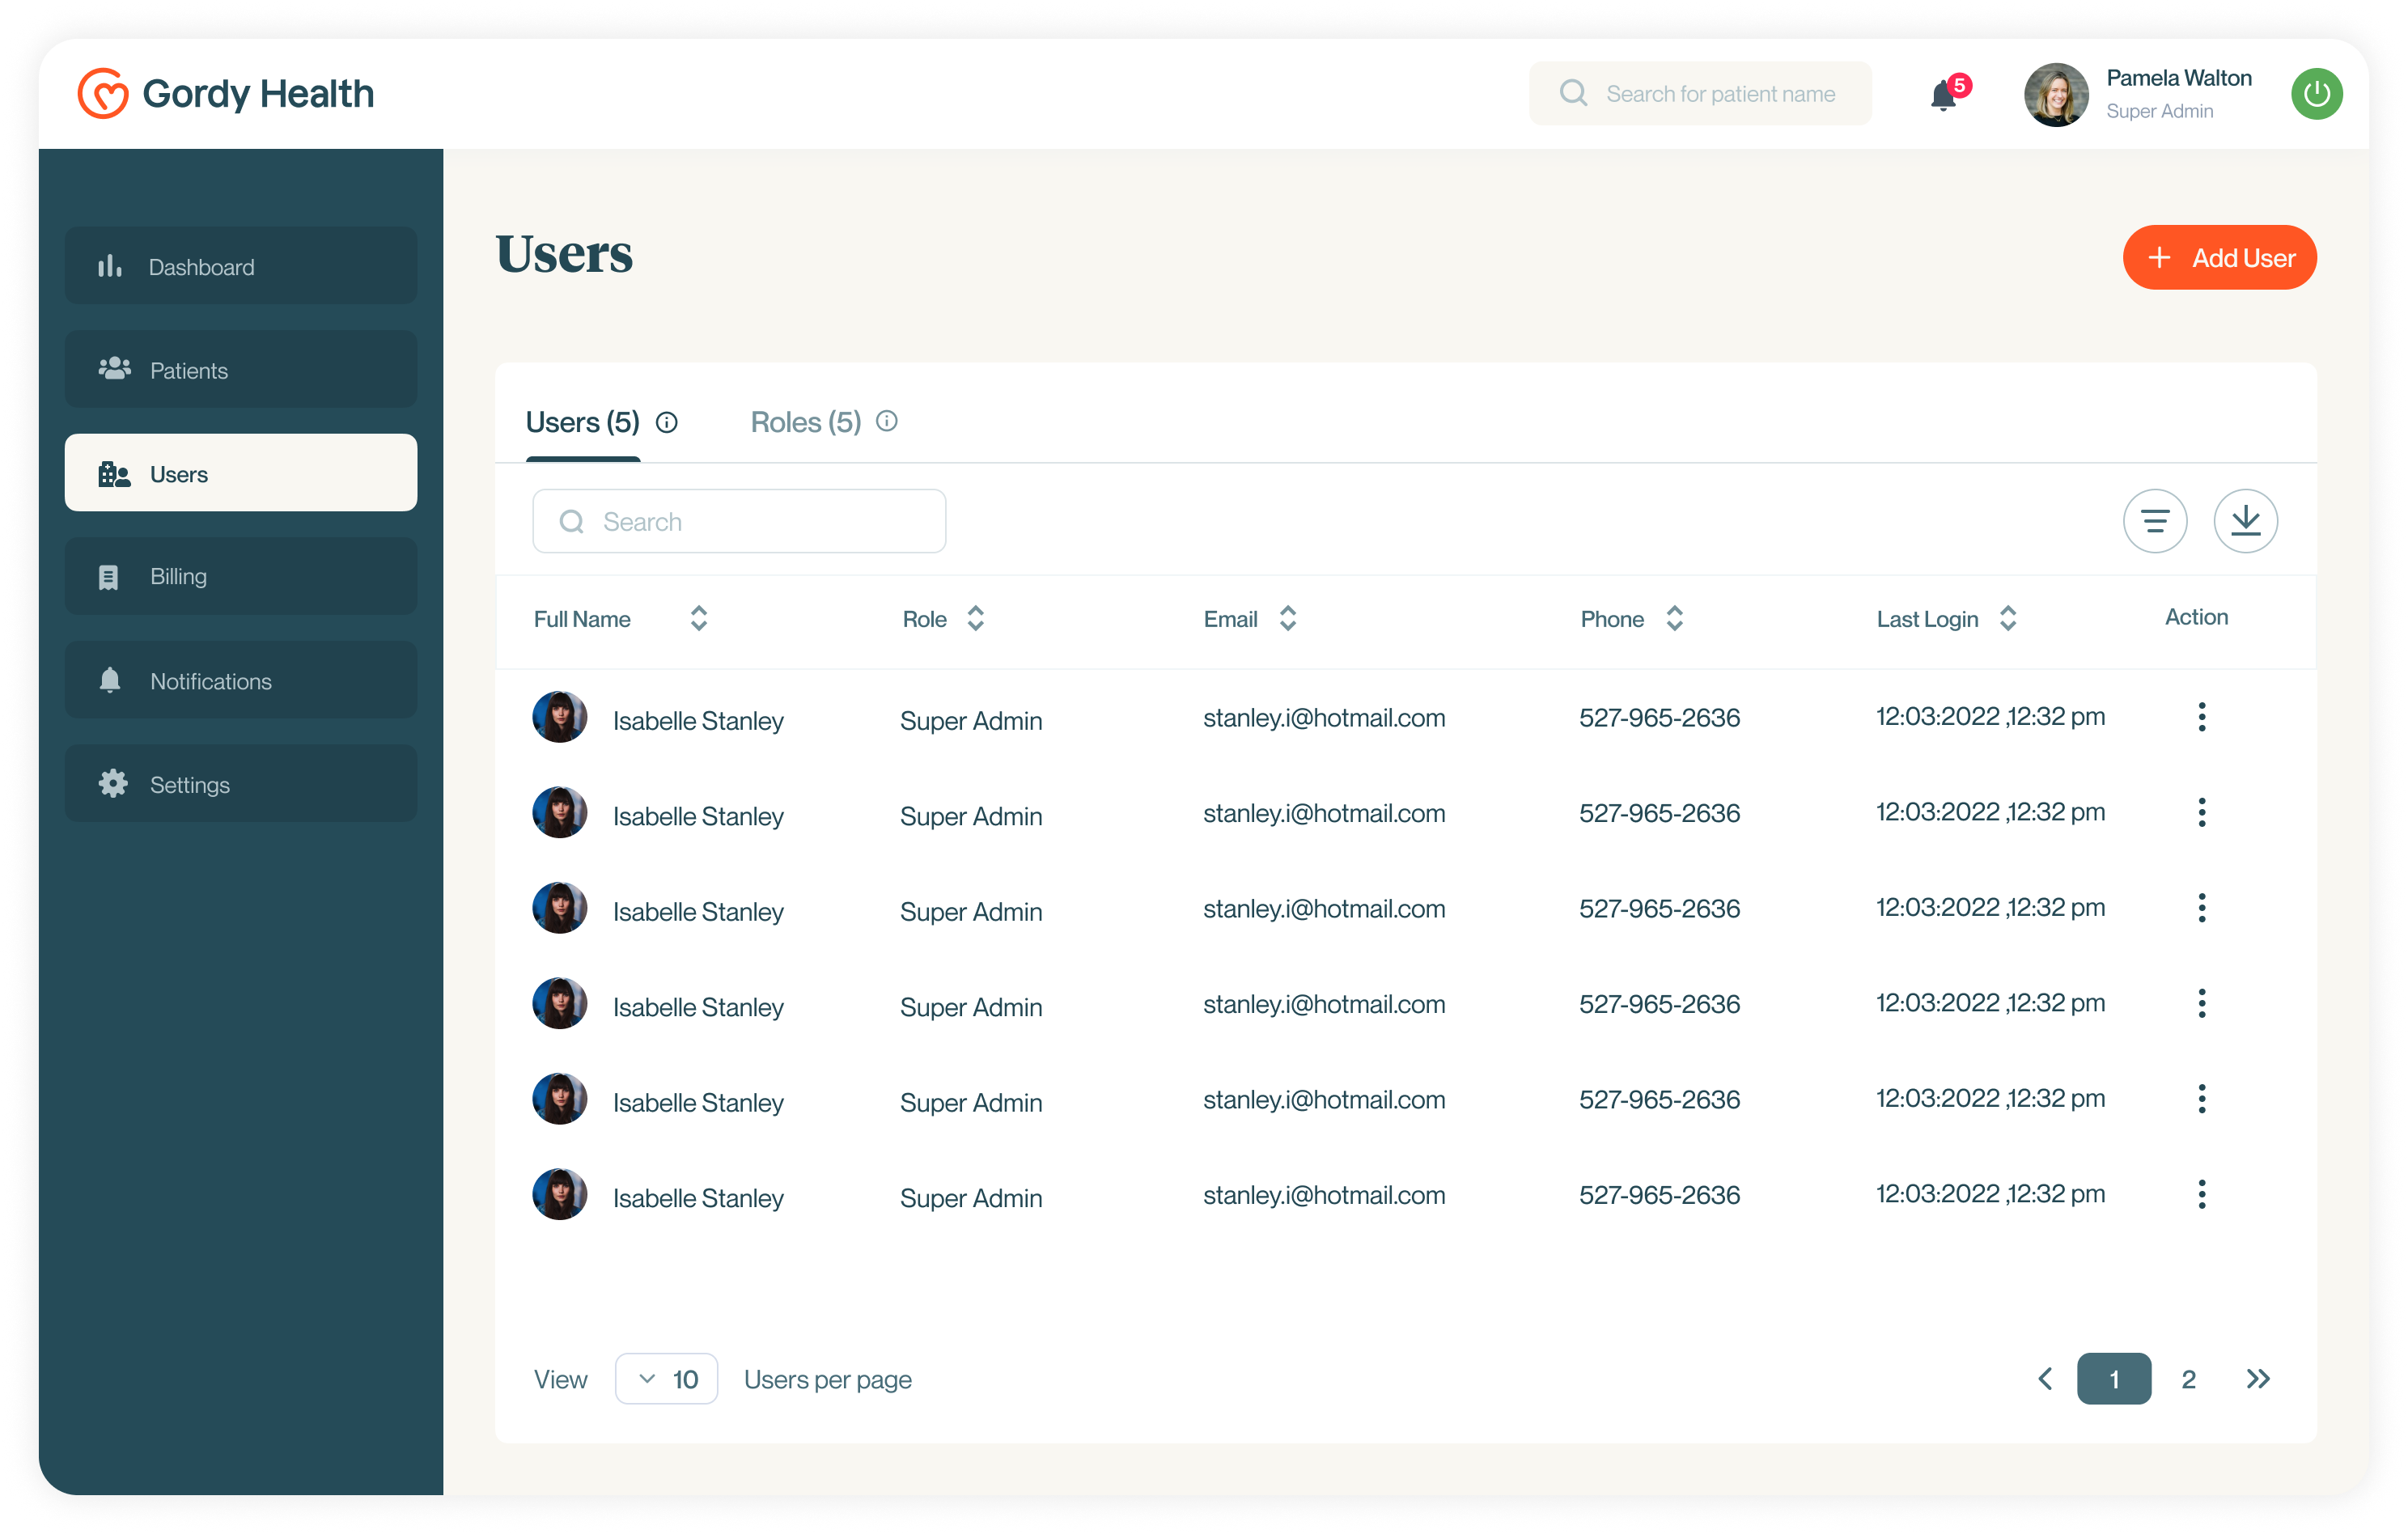
Onboarding World Class Clinical Care Team

KPI - Reputated Physicians on Platform

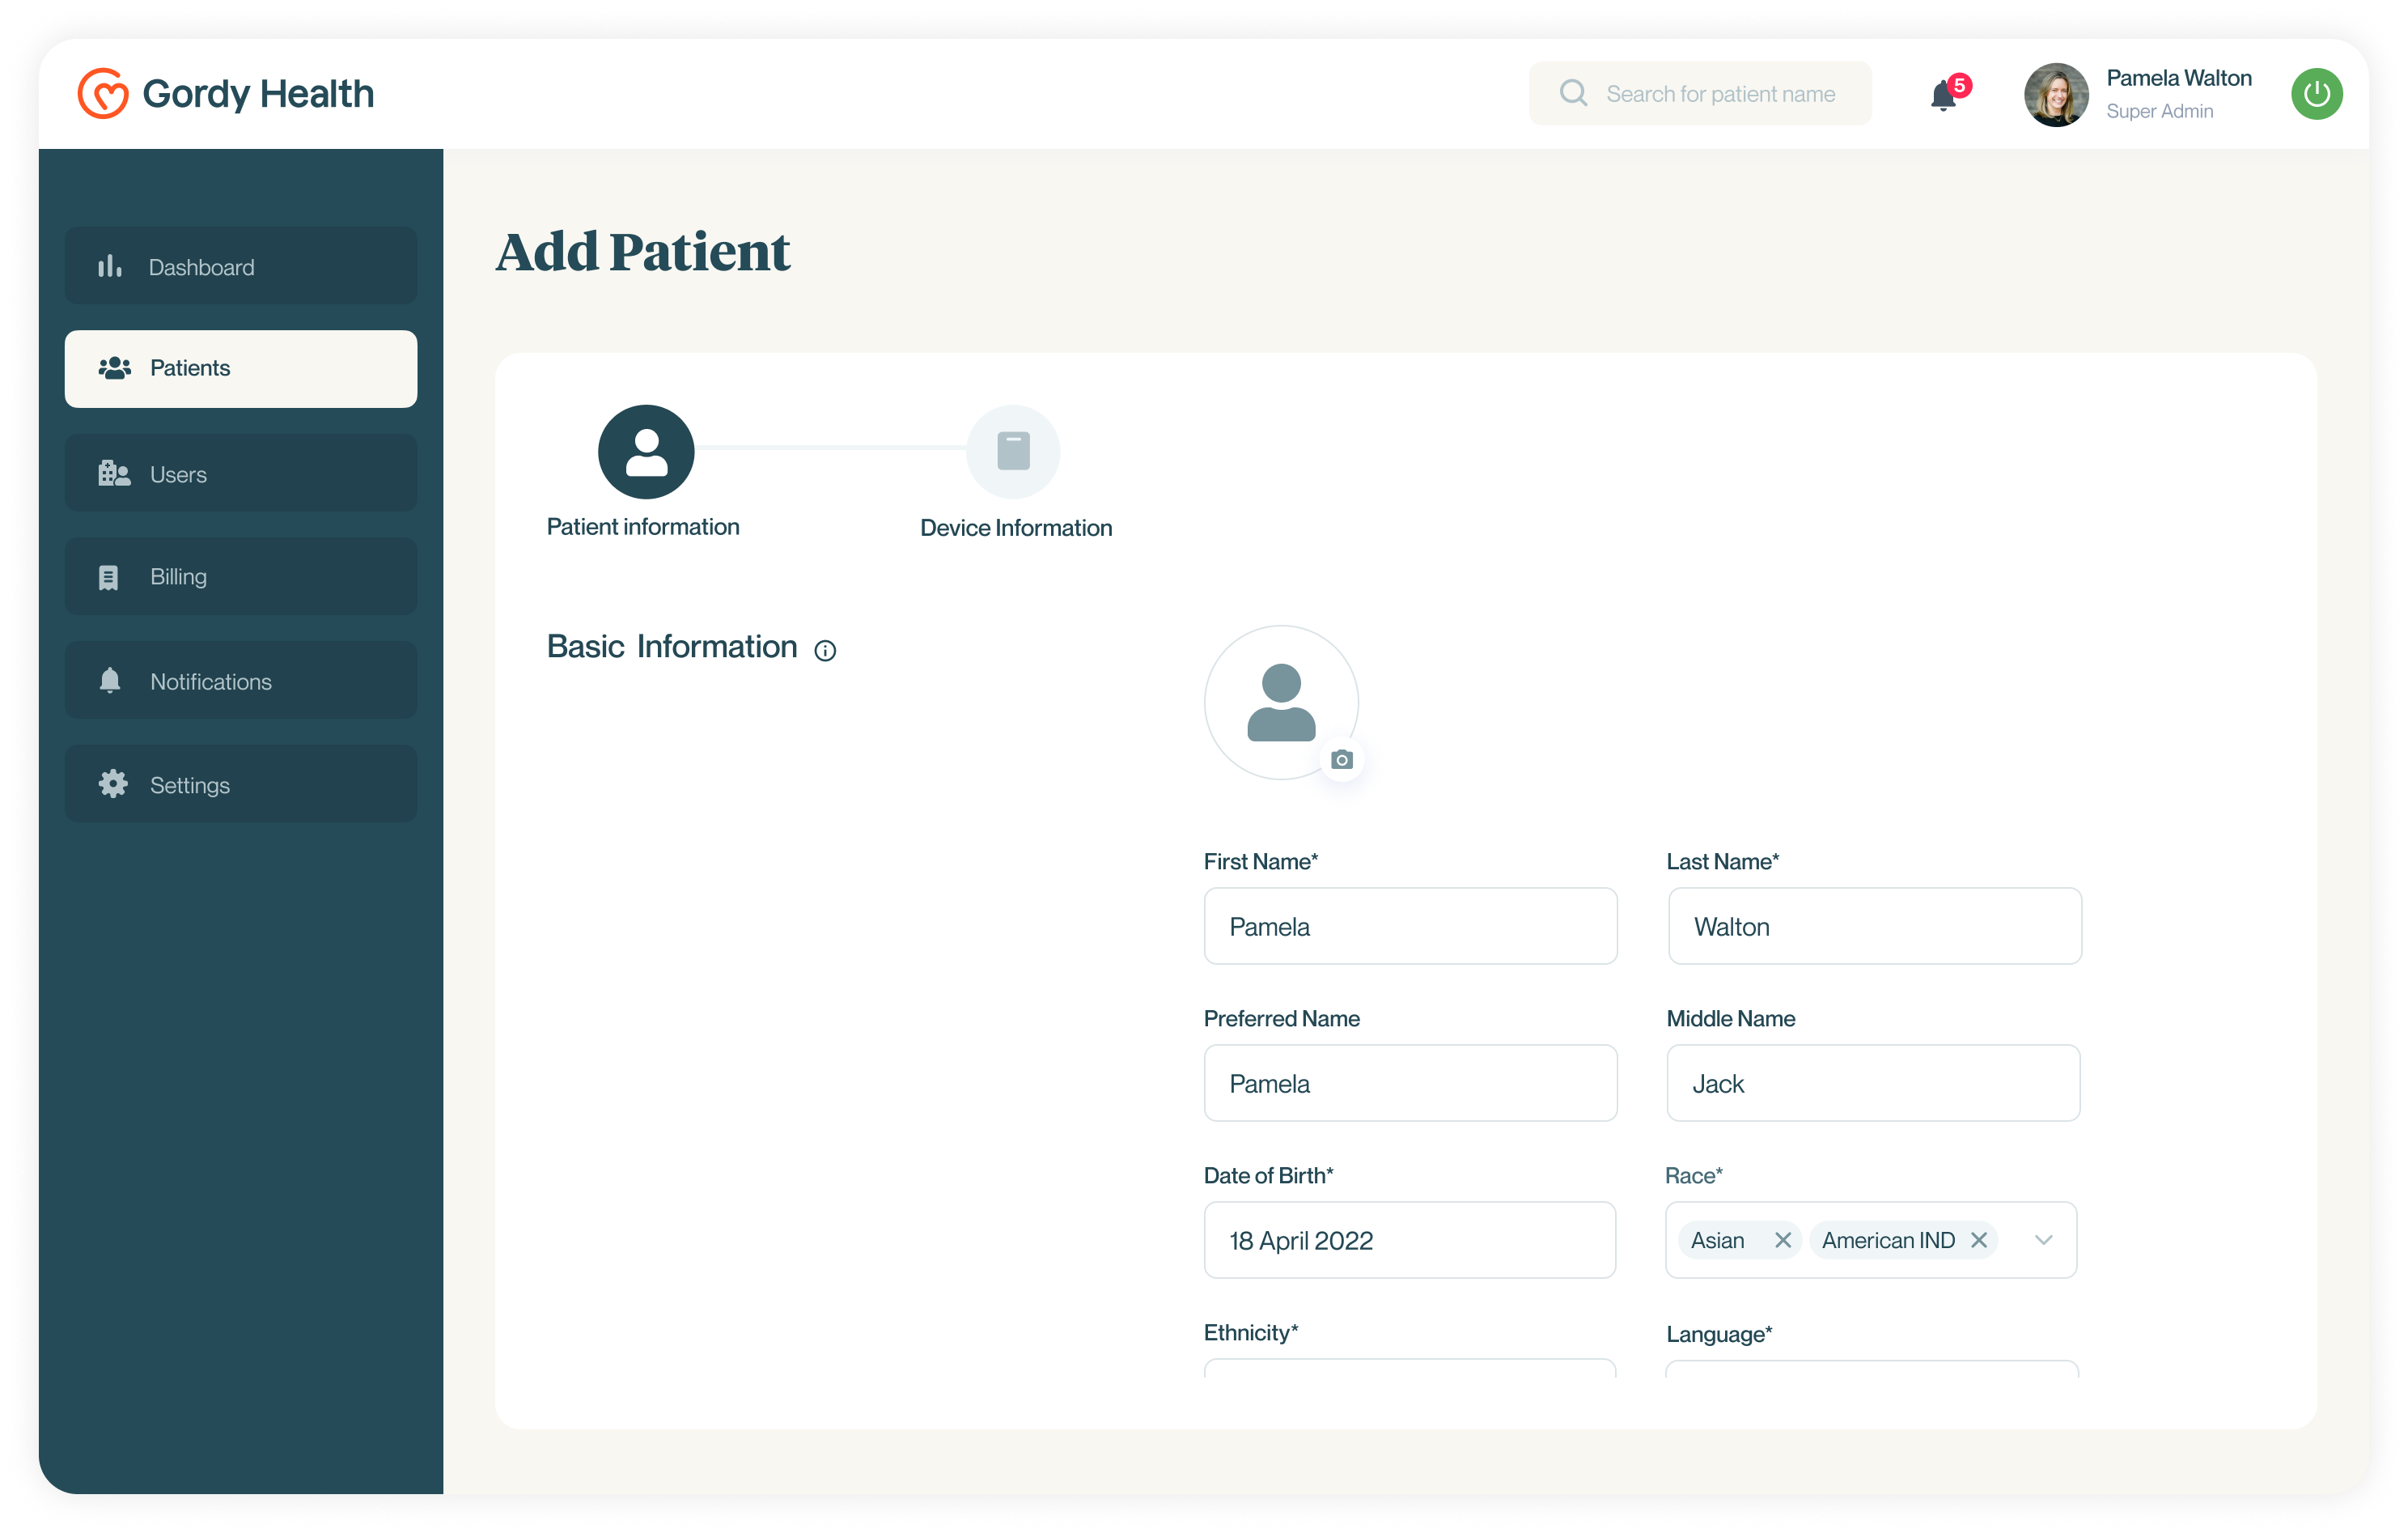
Onboarding Patients that need Critical Care

KPI - # of Patients

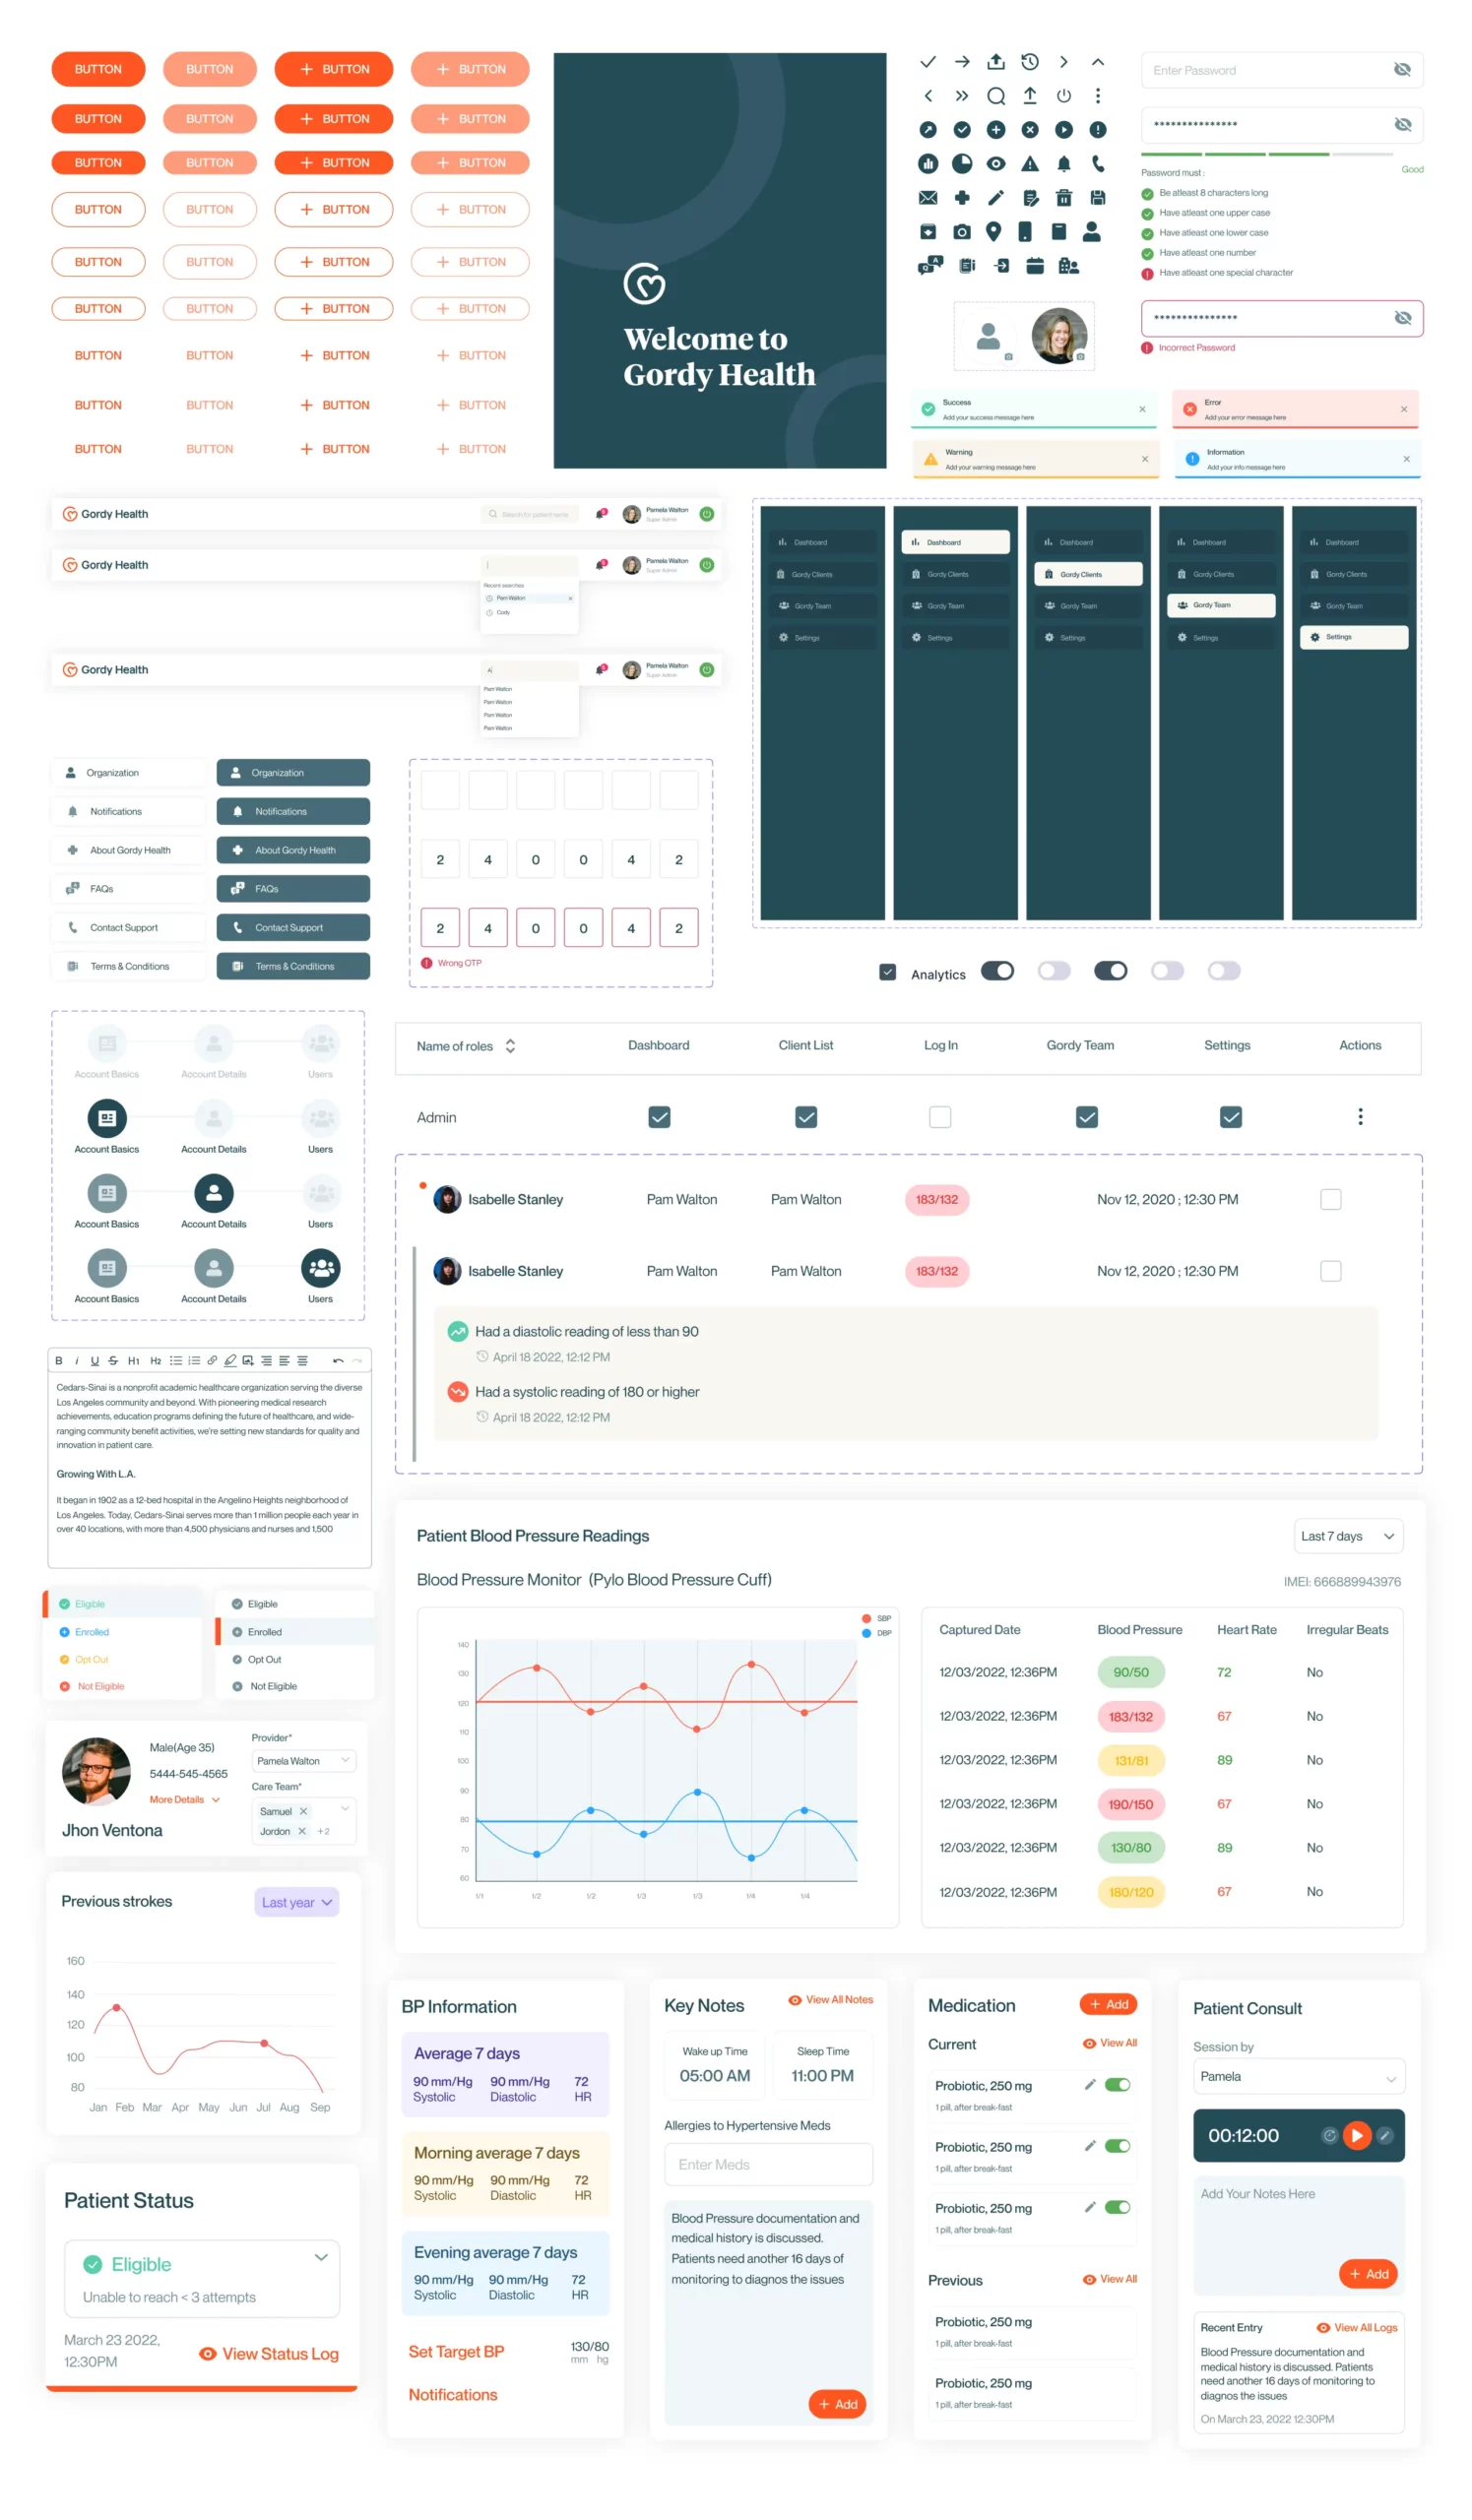
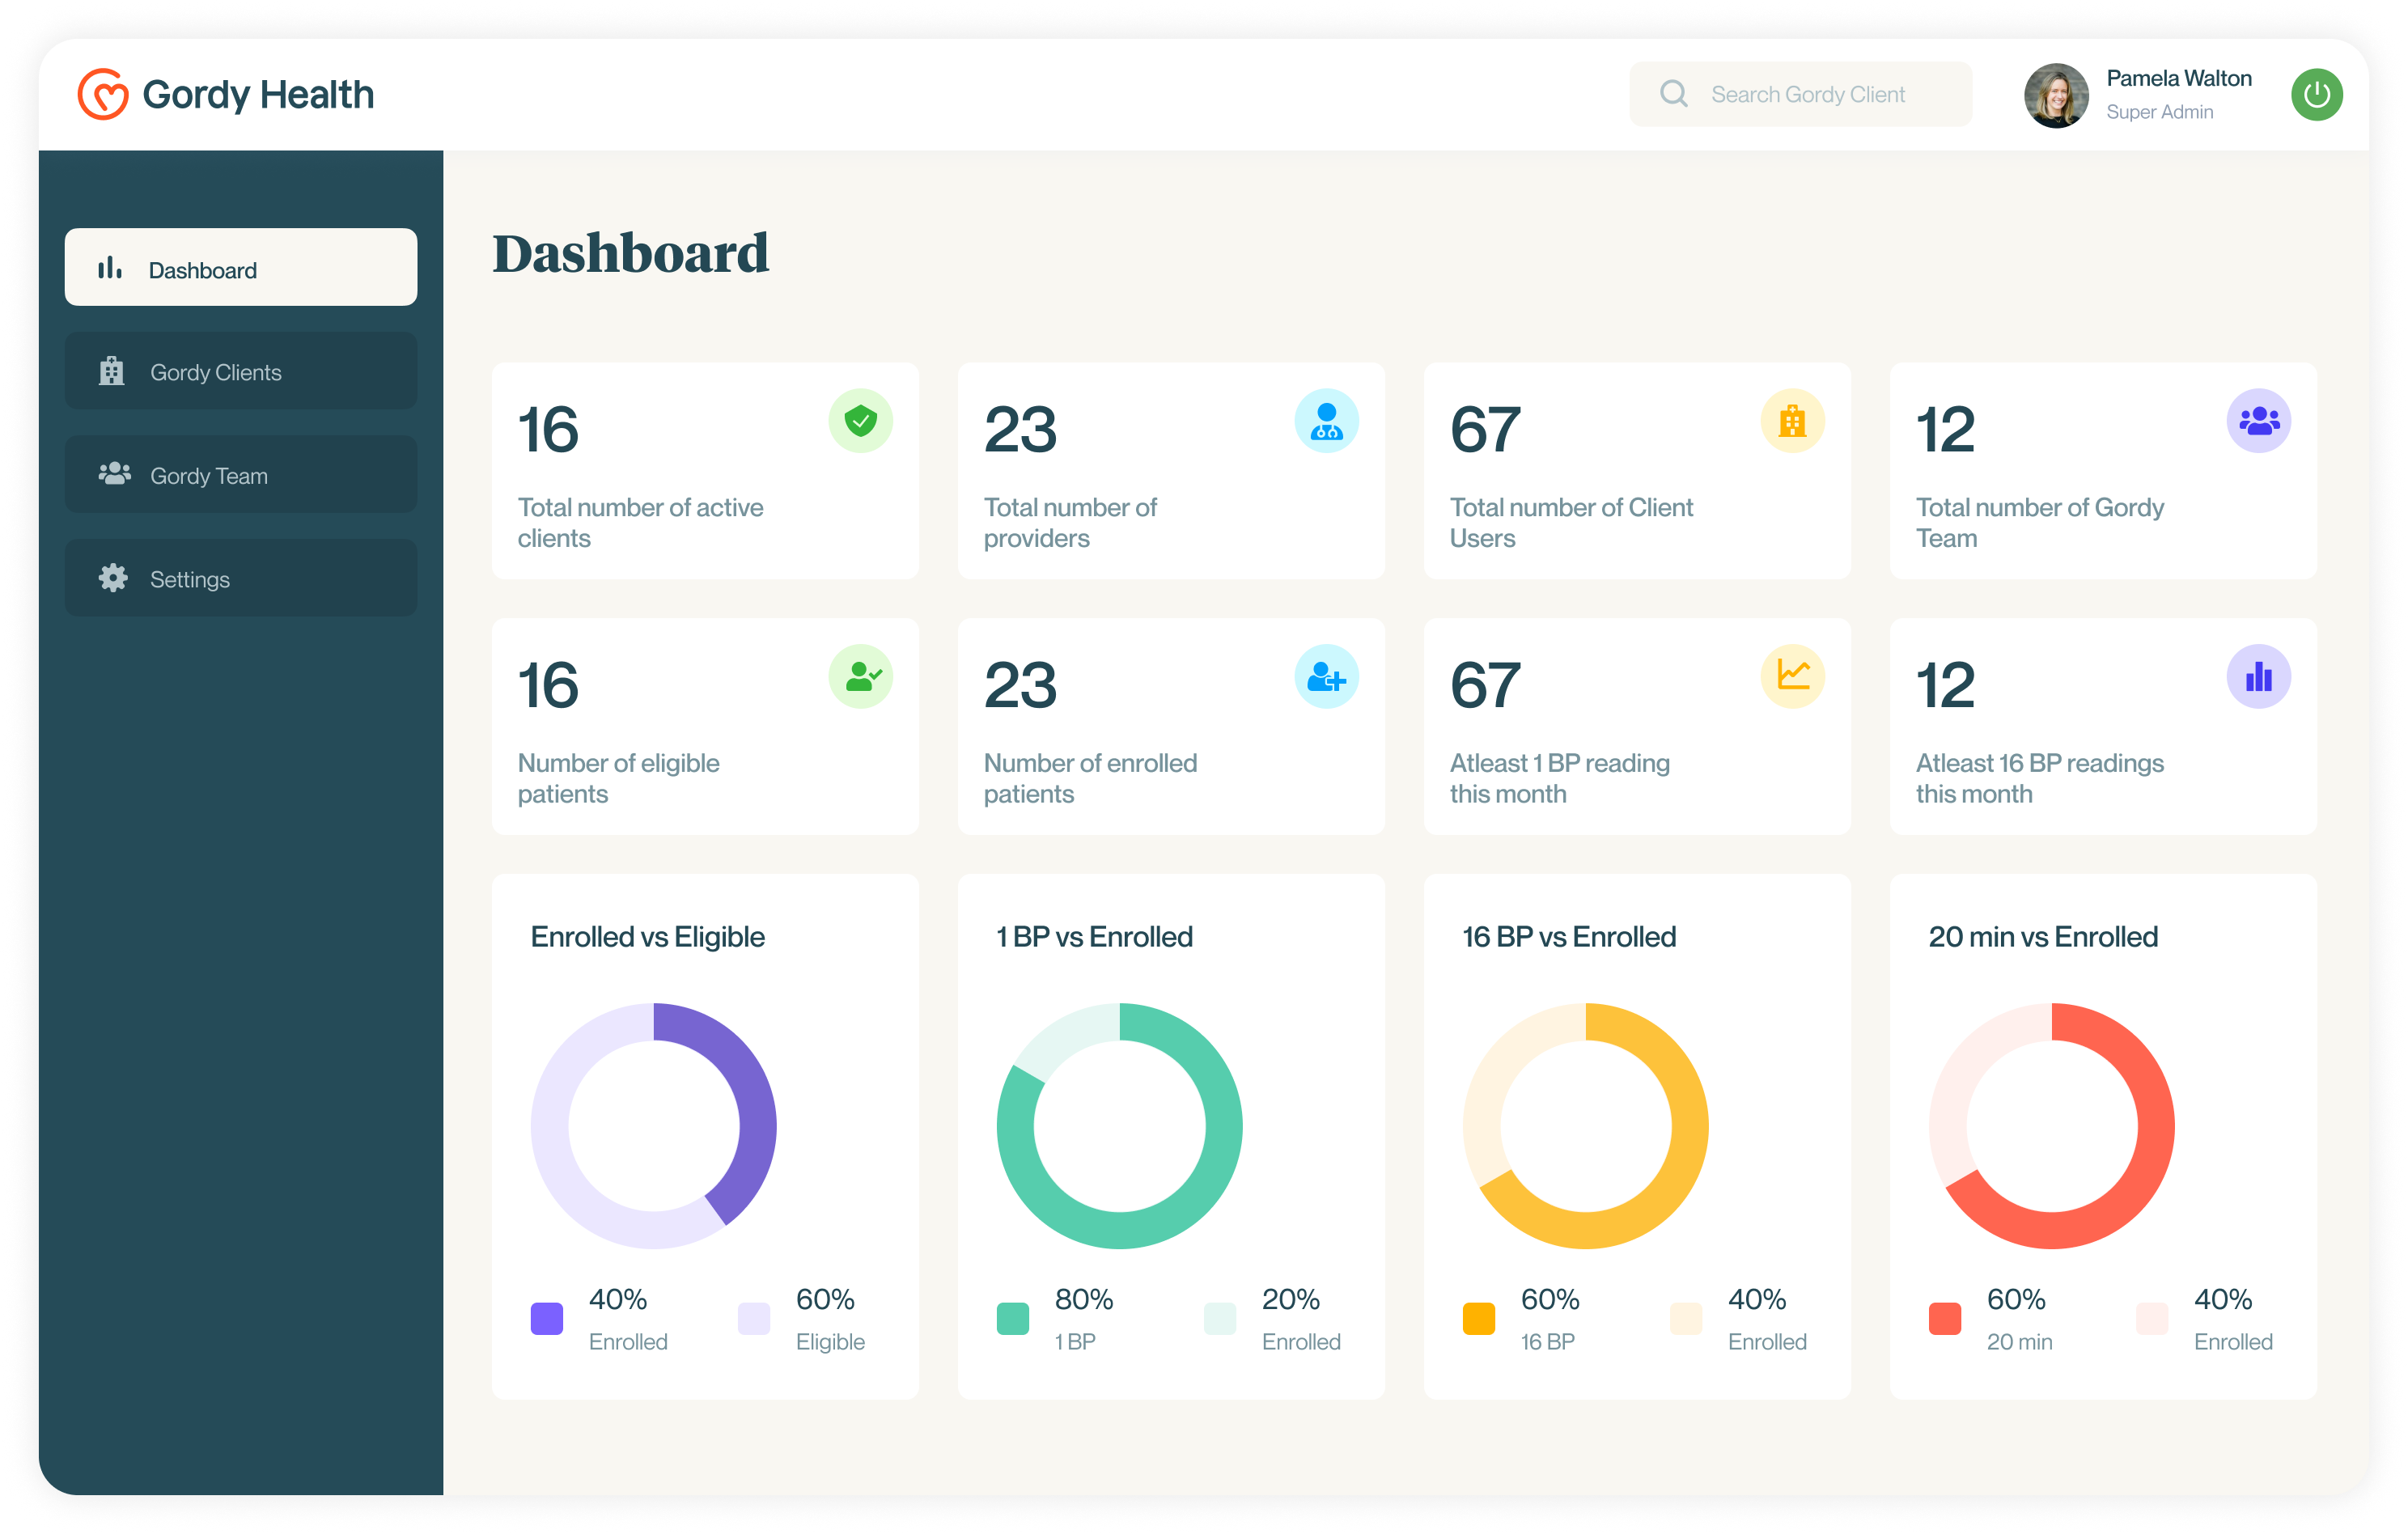
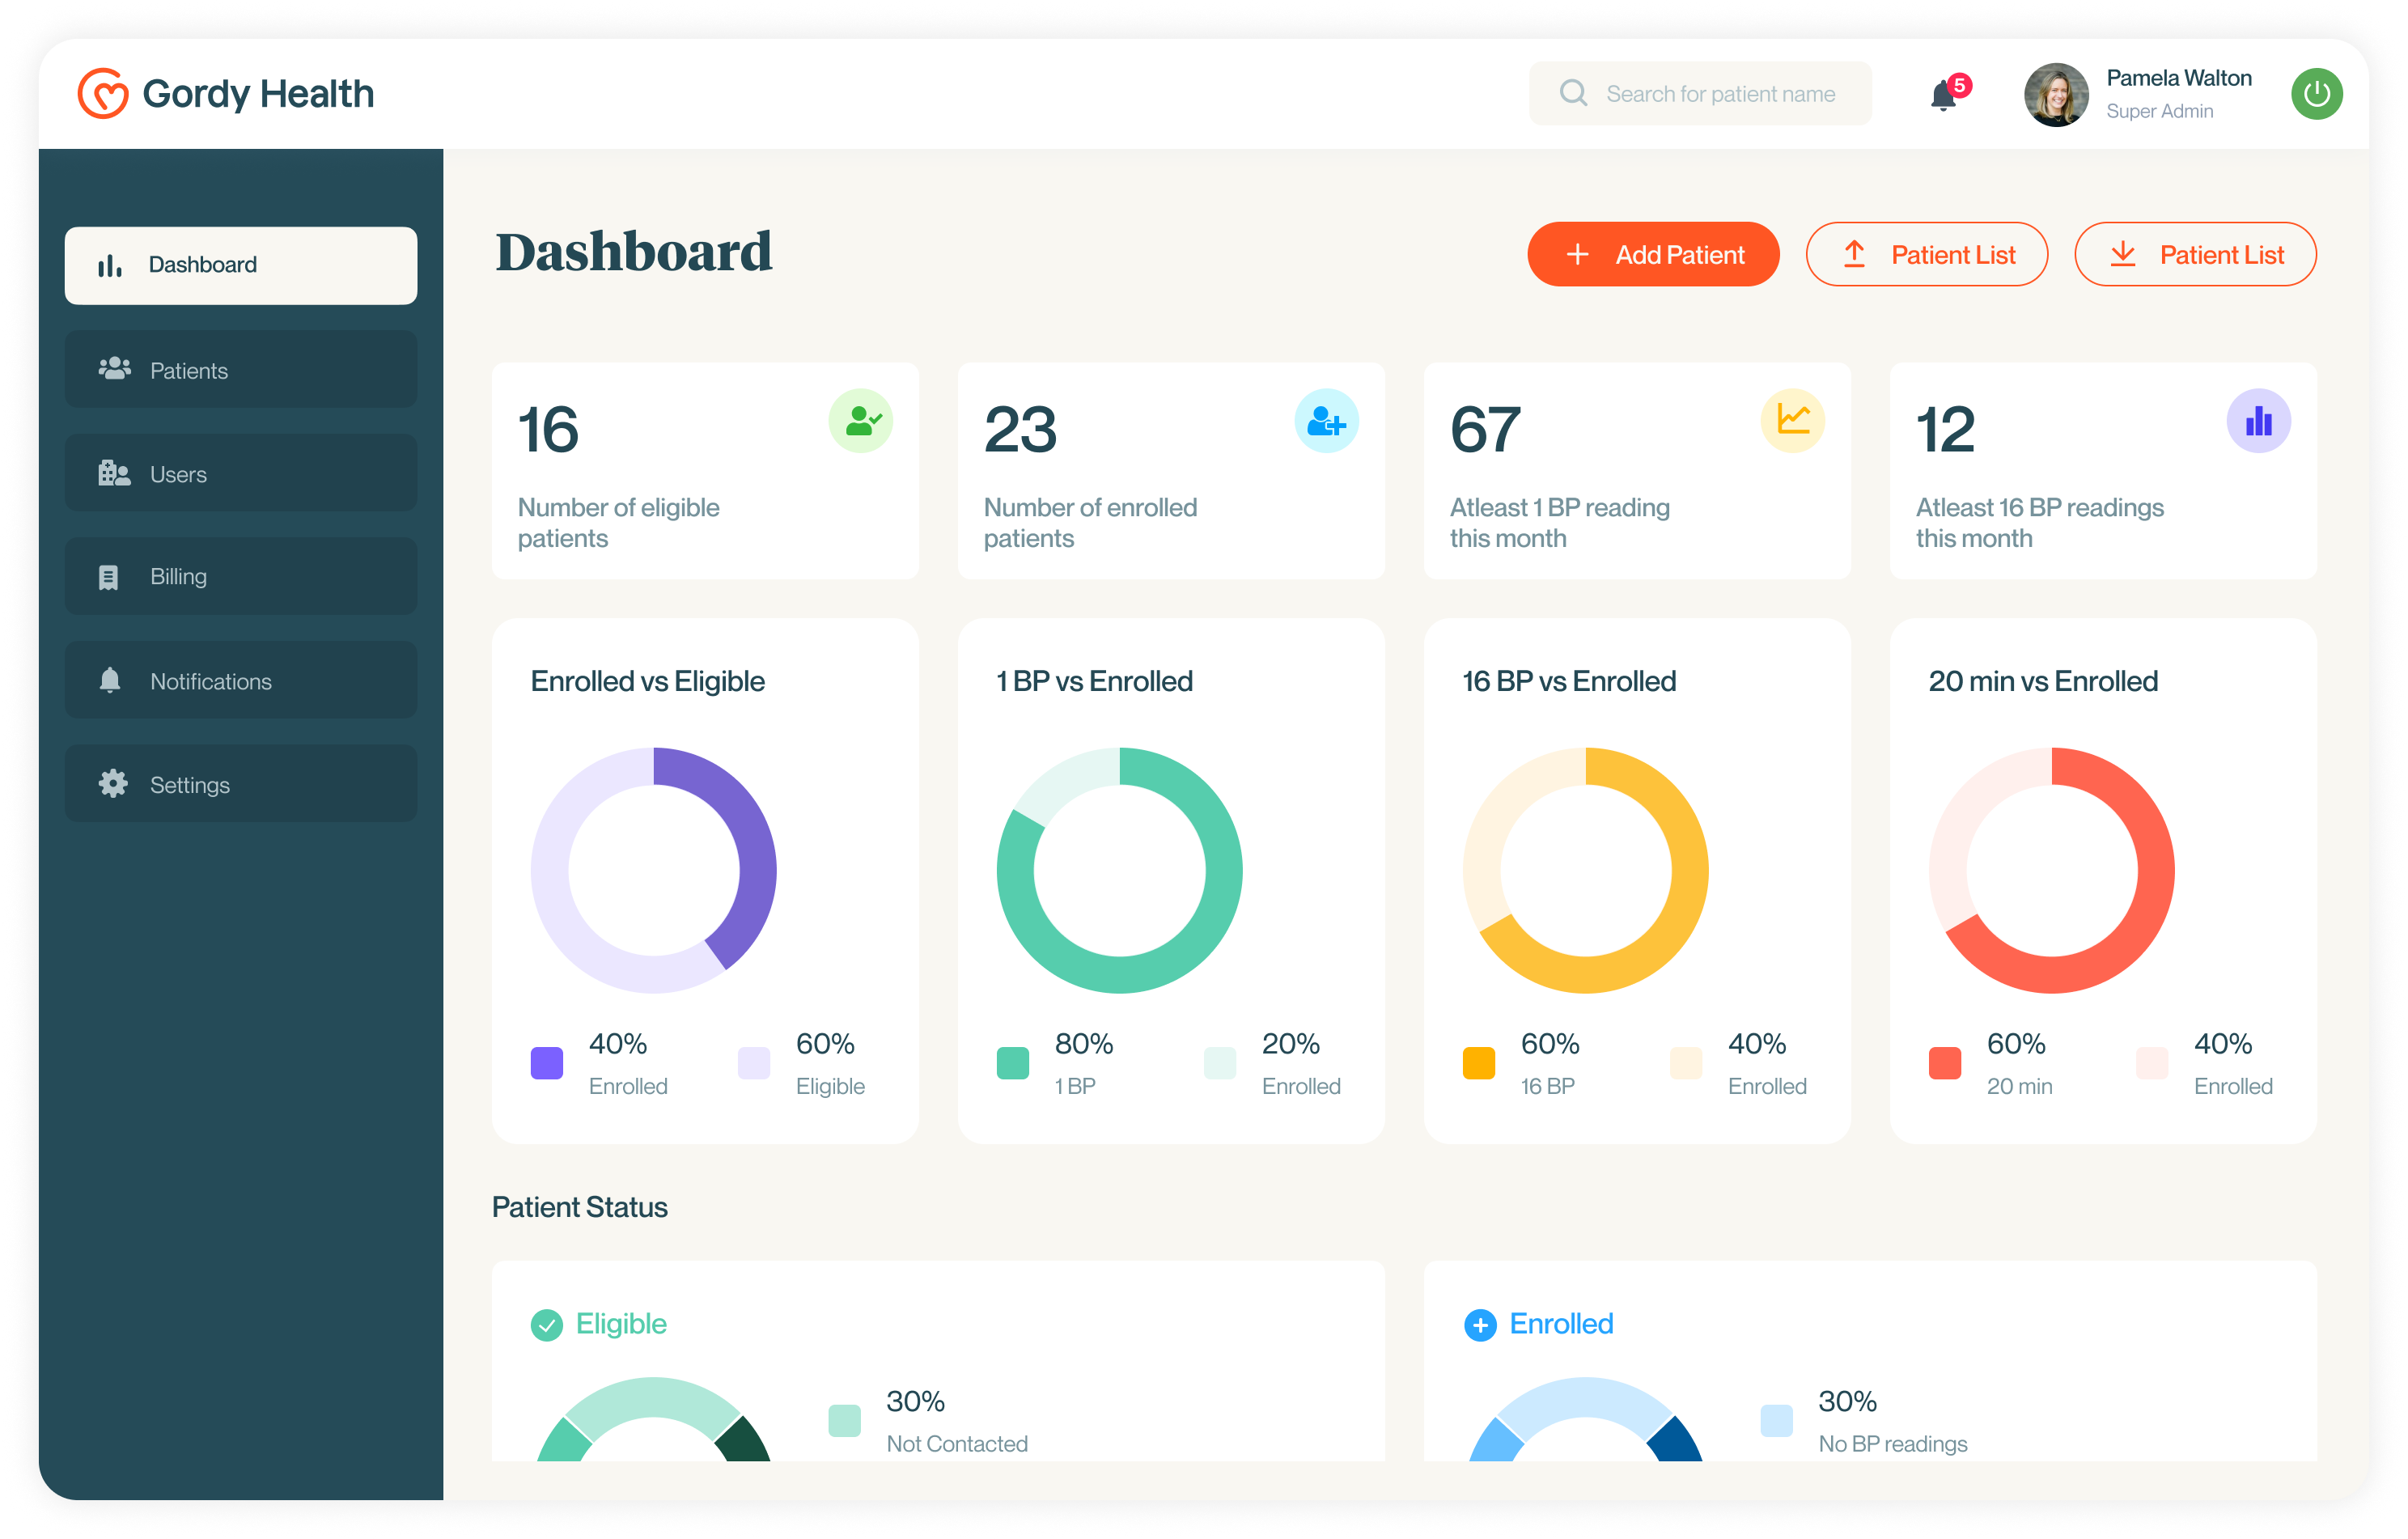
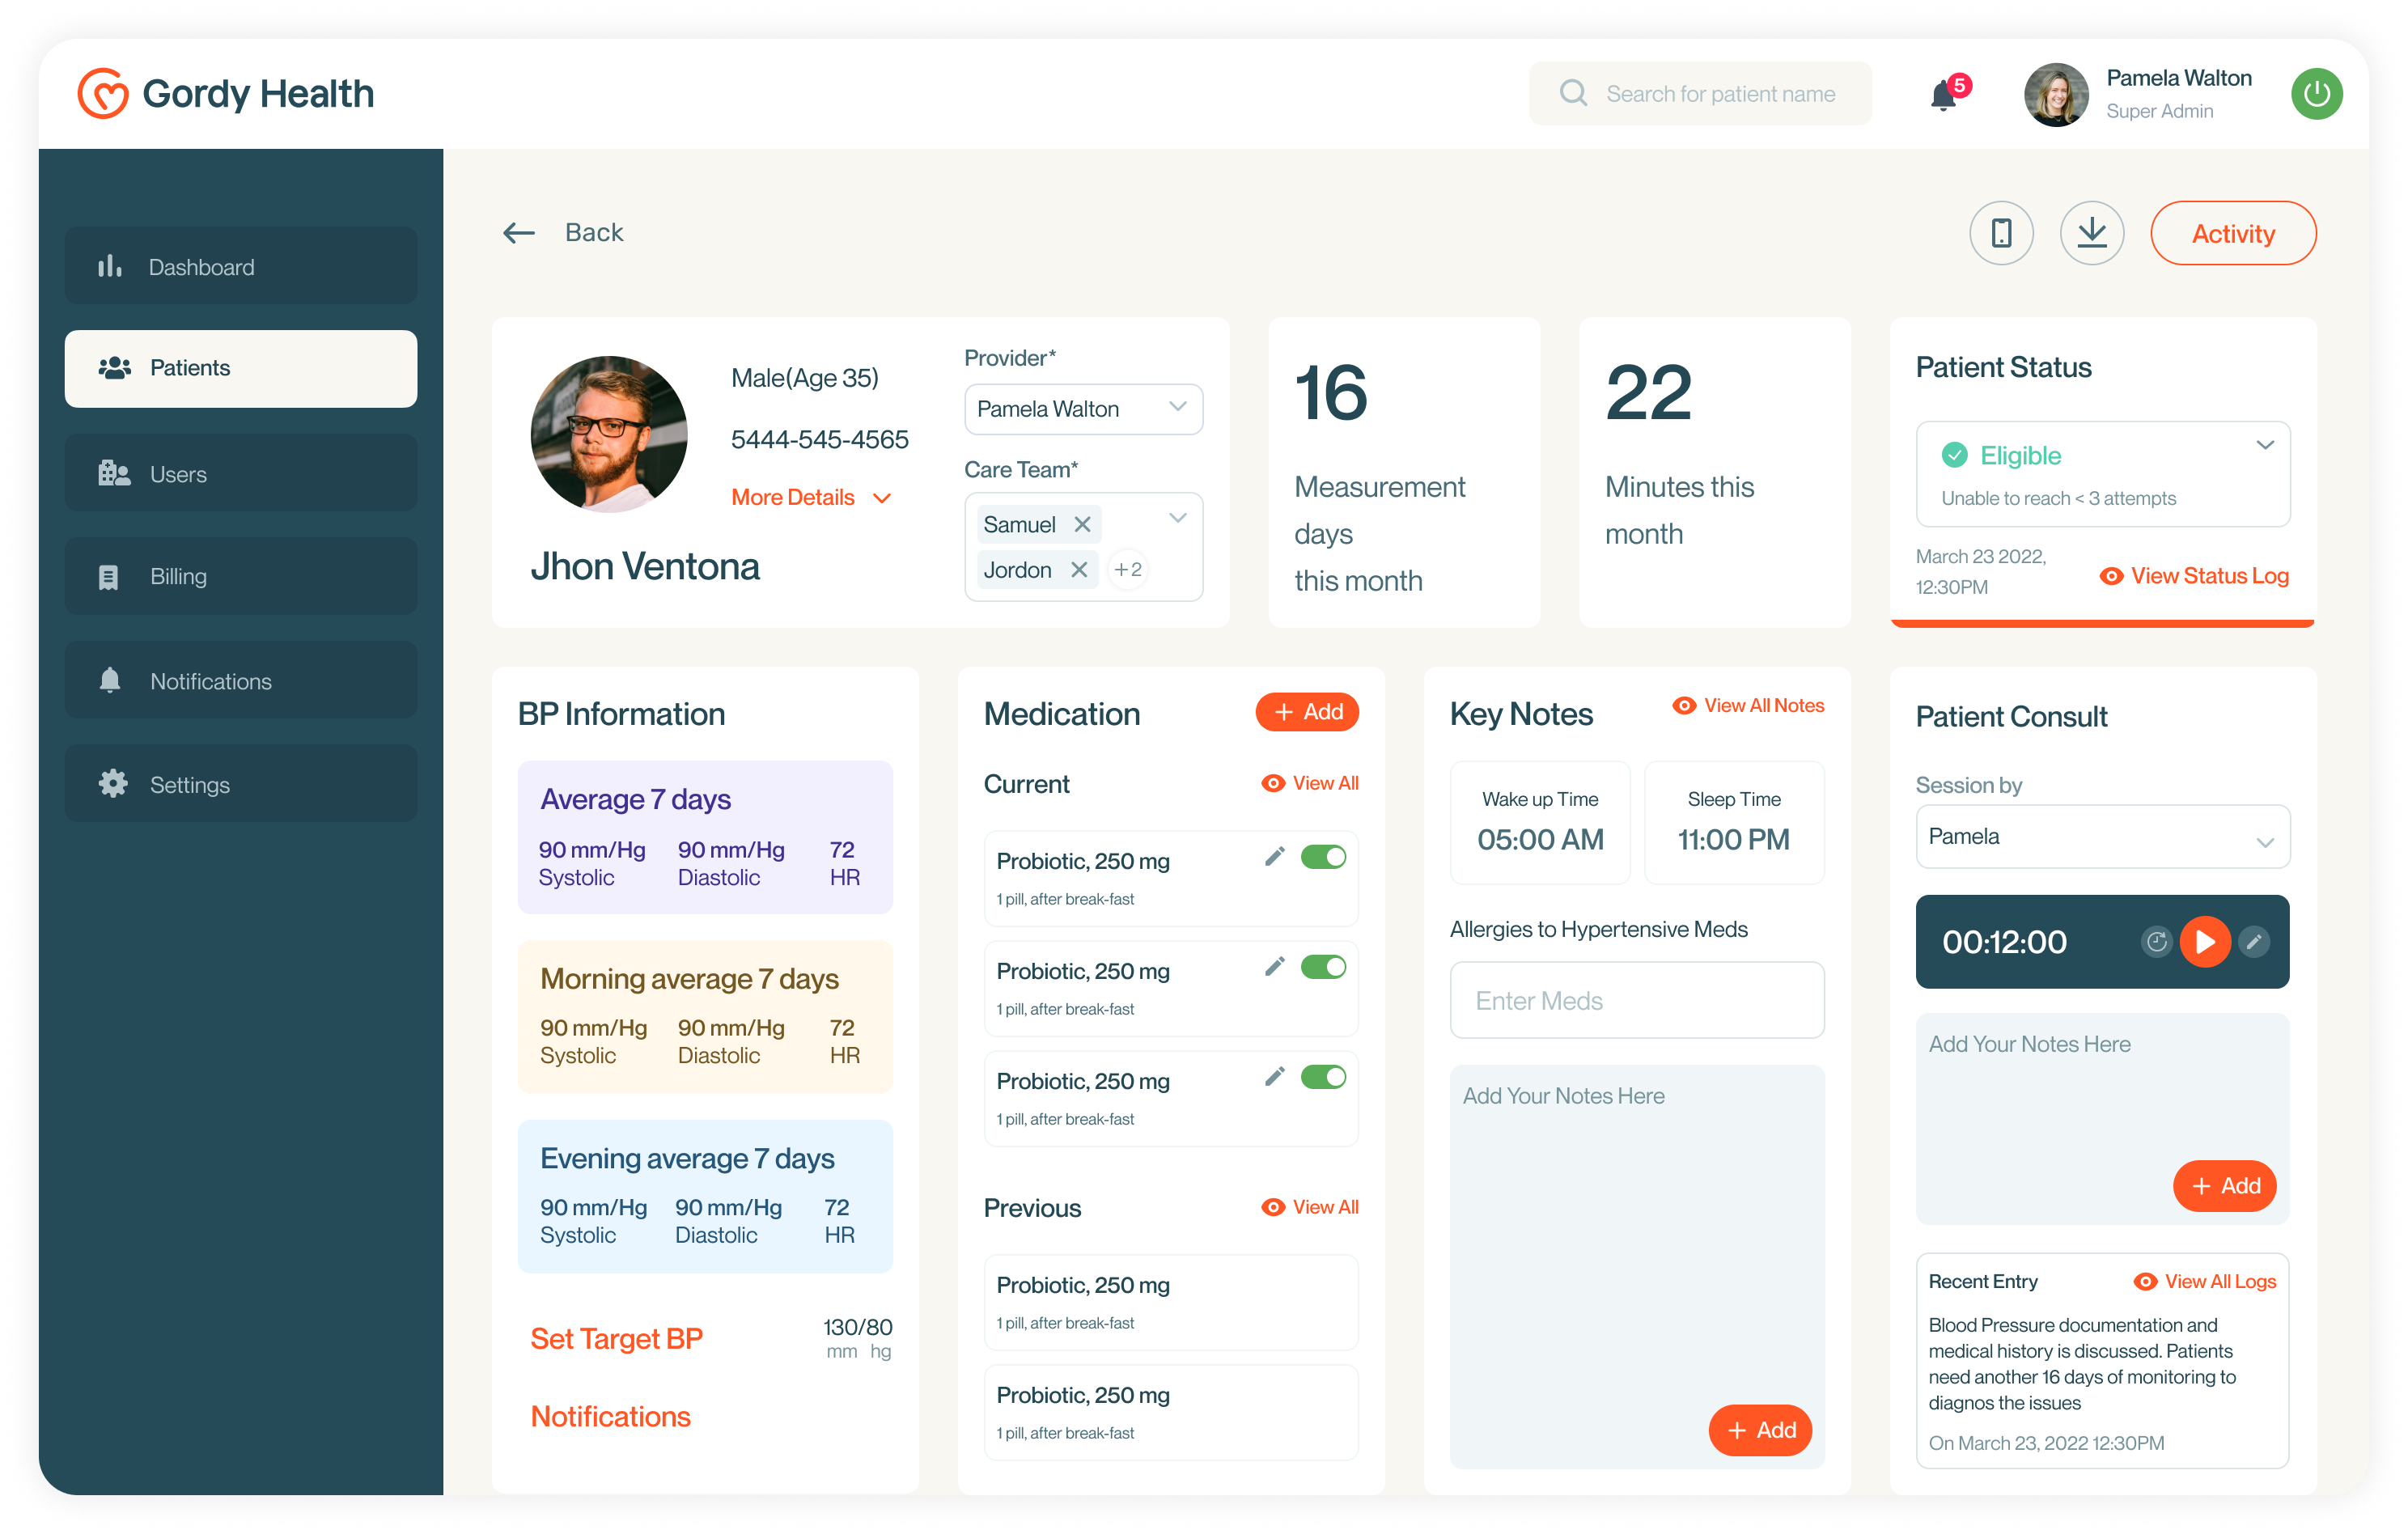
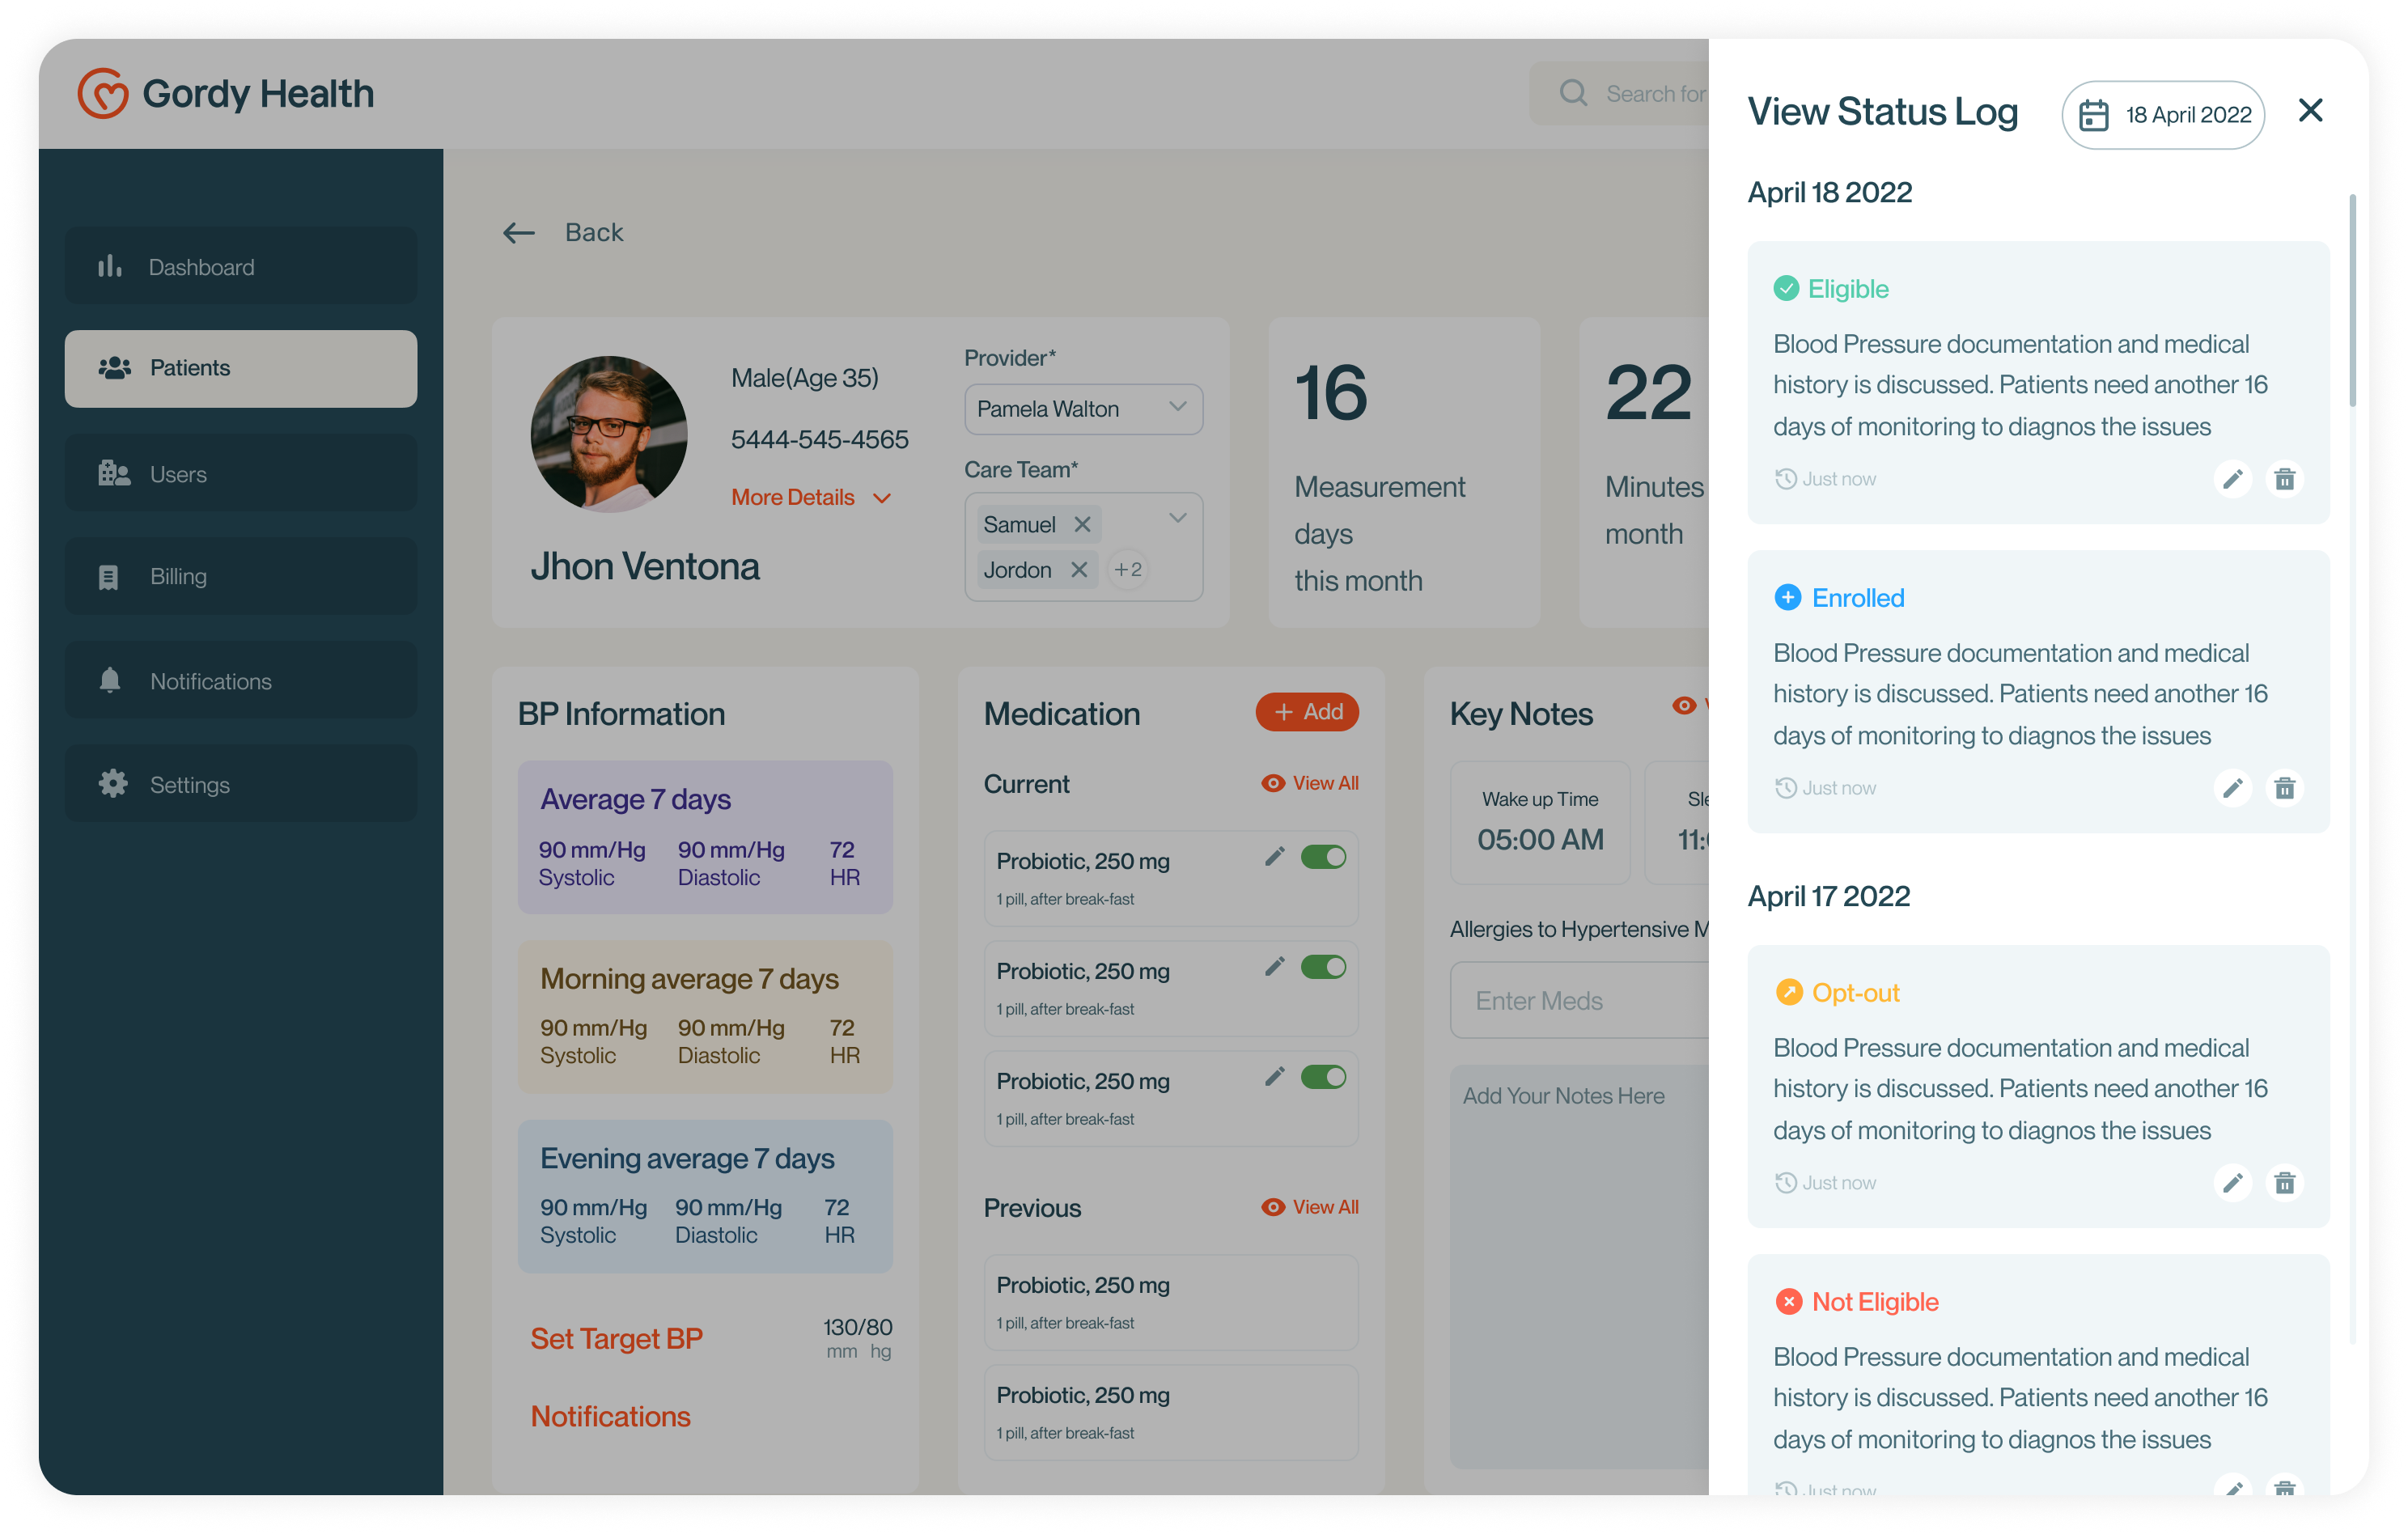
Platform Analytics & Data Visualization

KPI - Data collected for AI Optimization

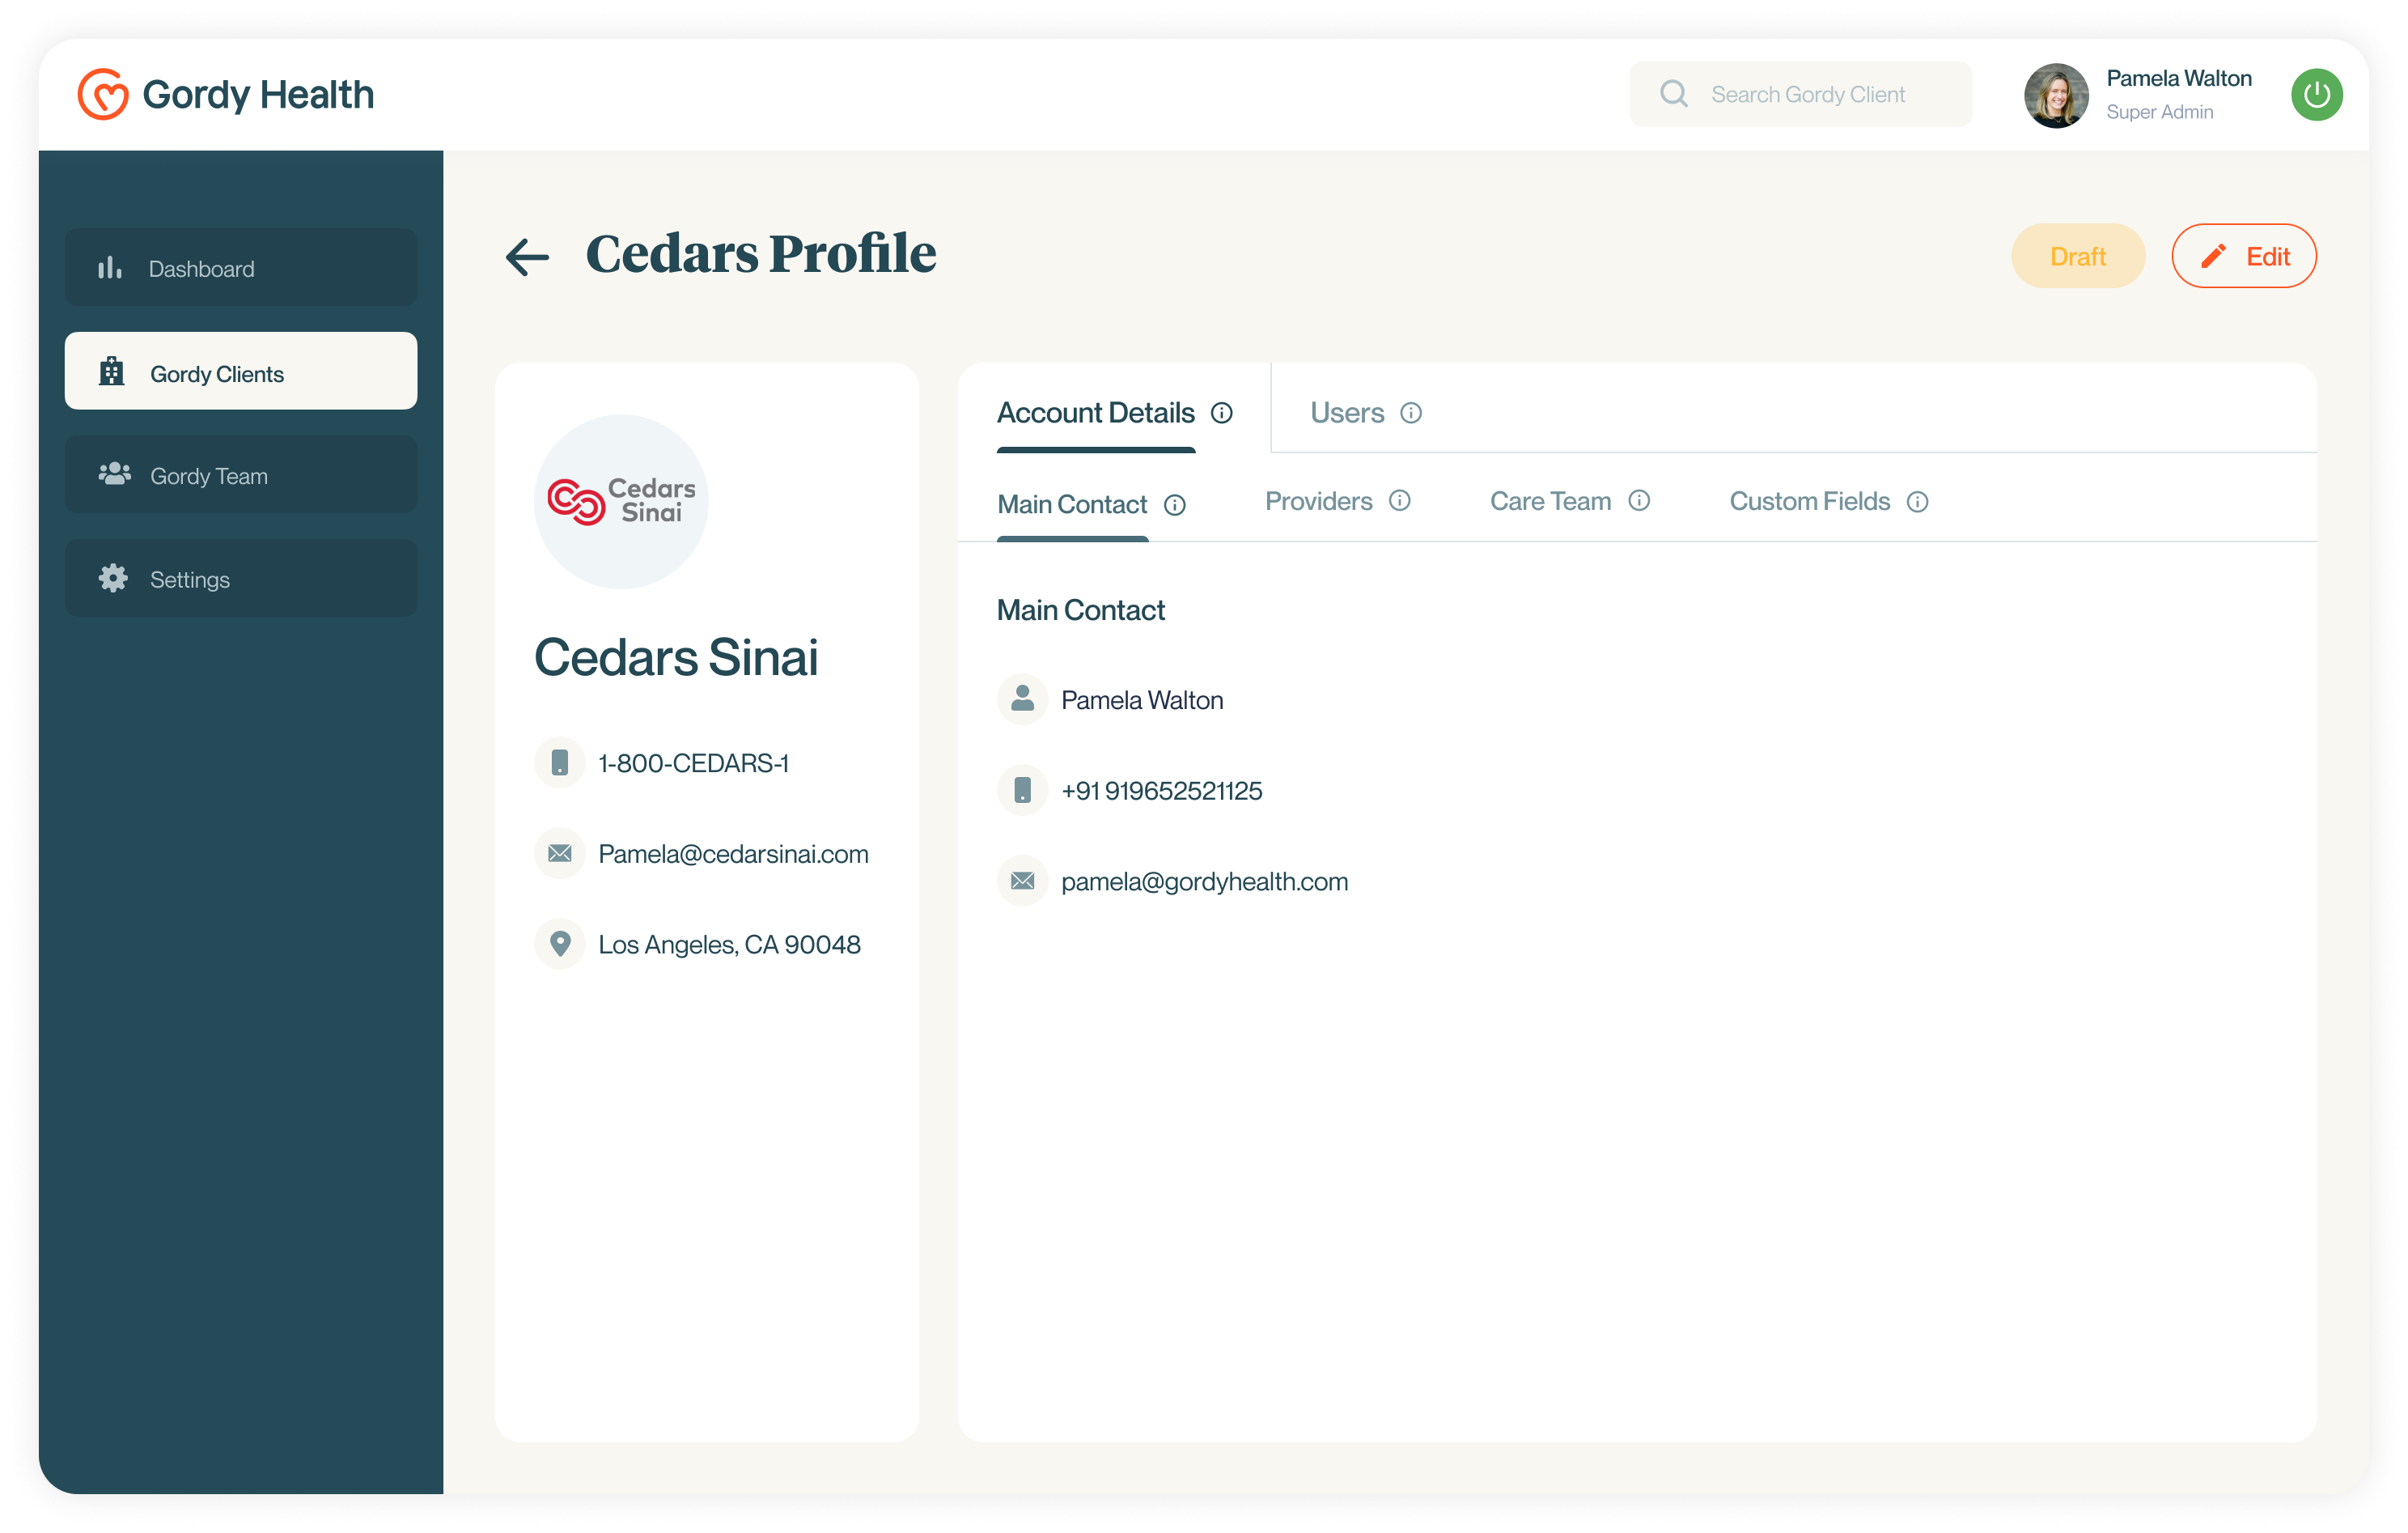
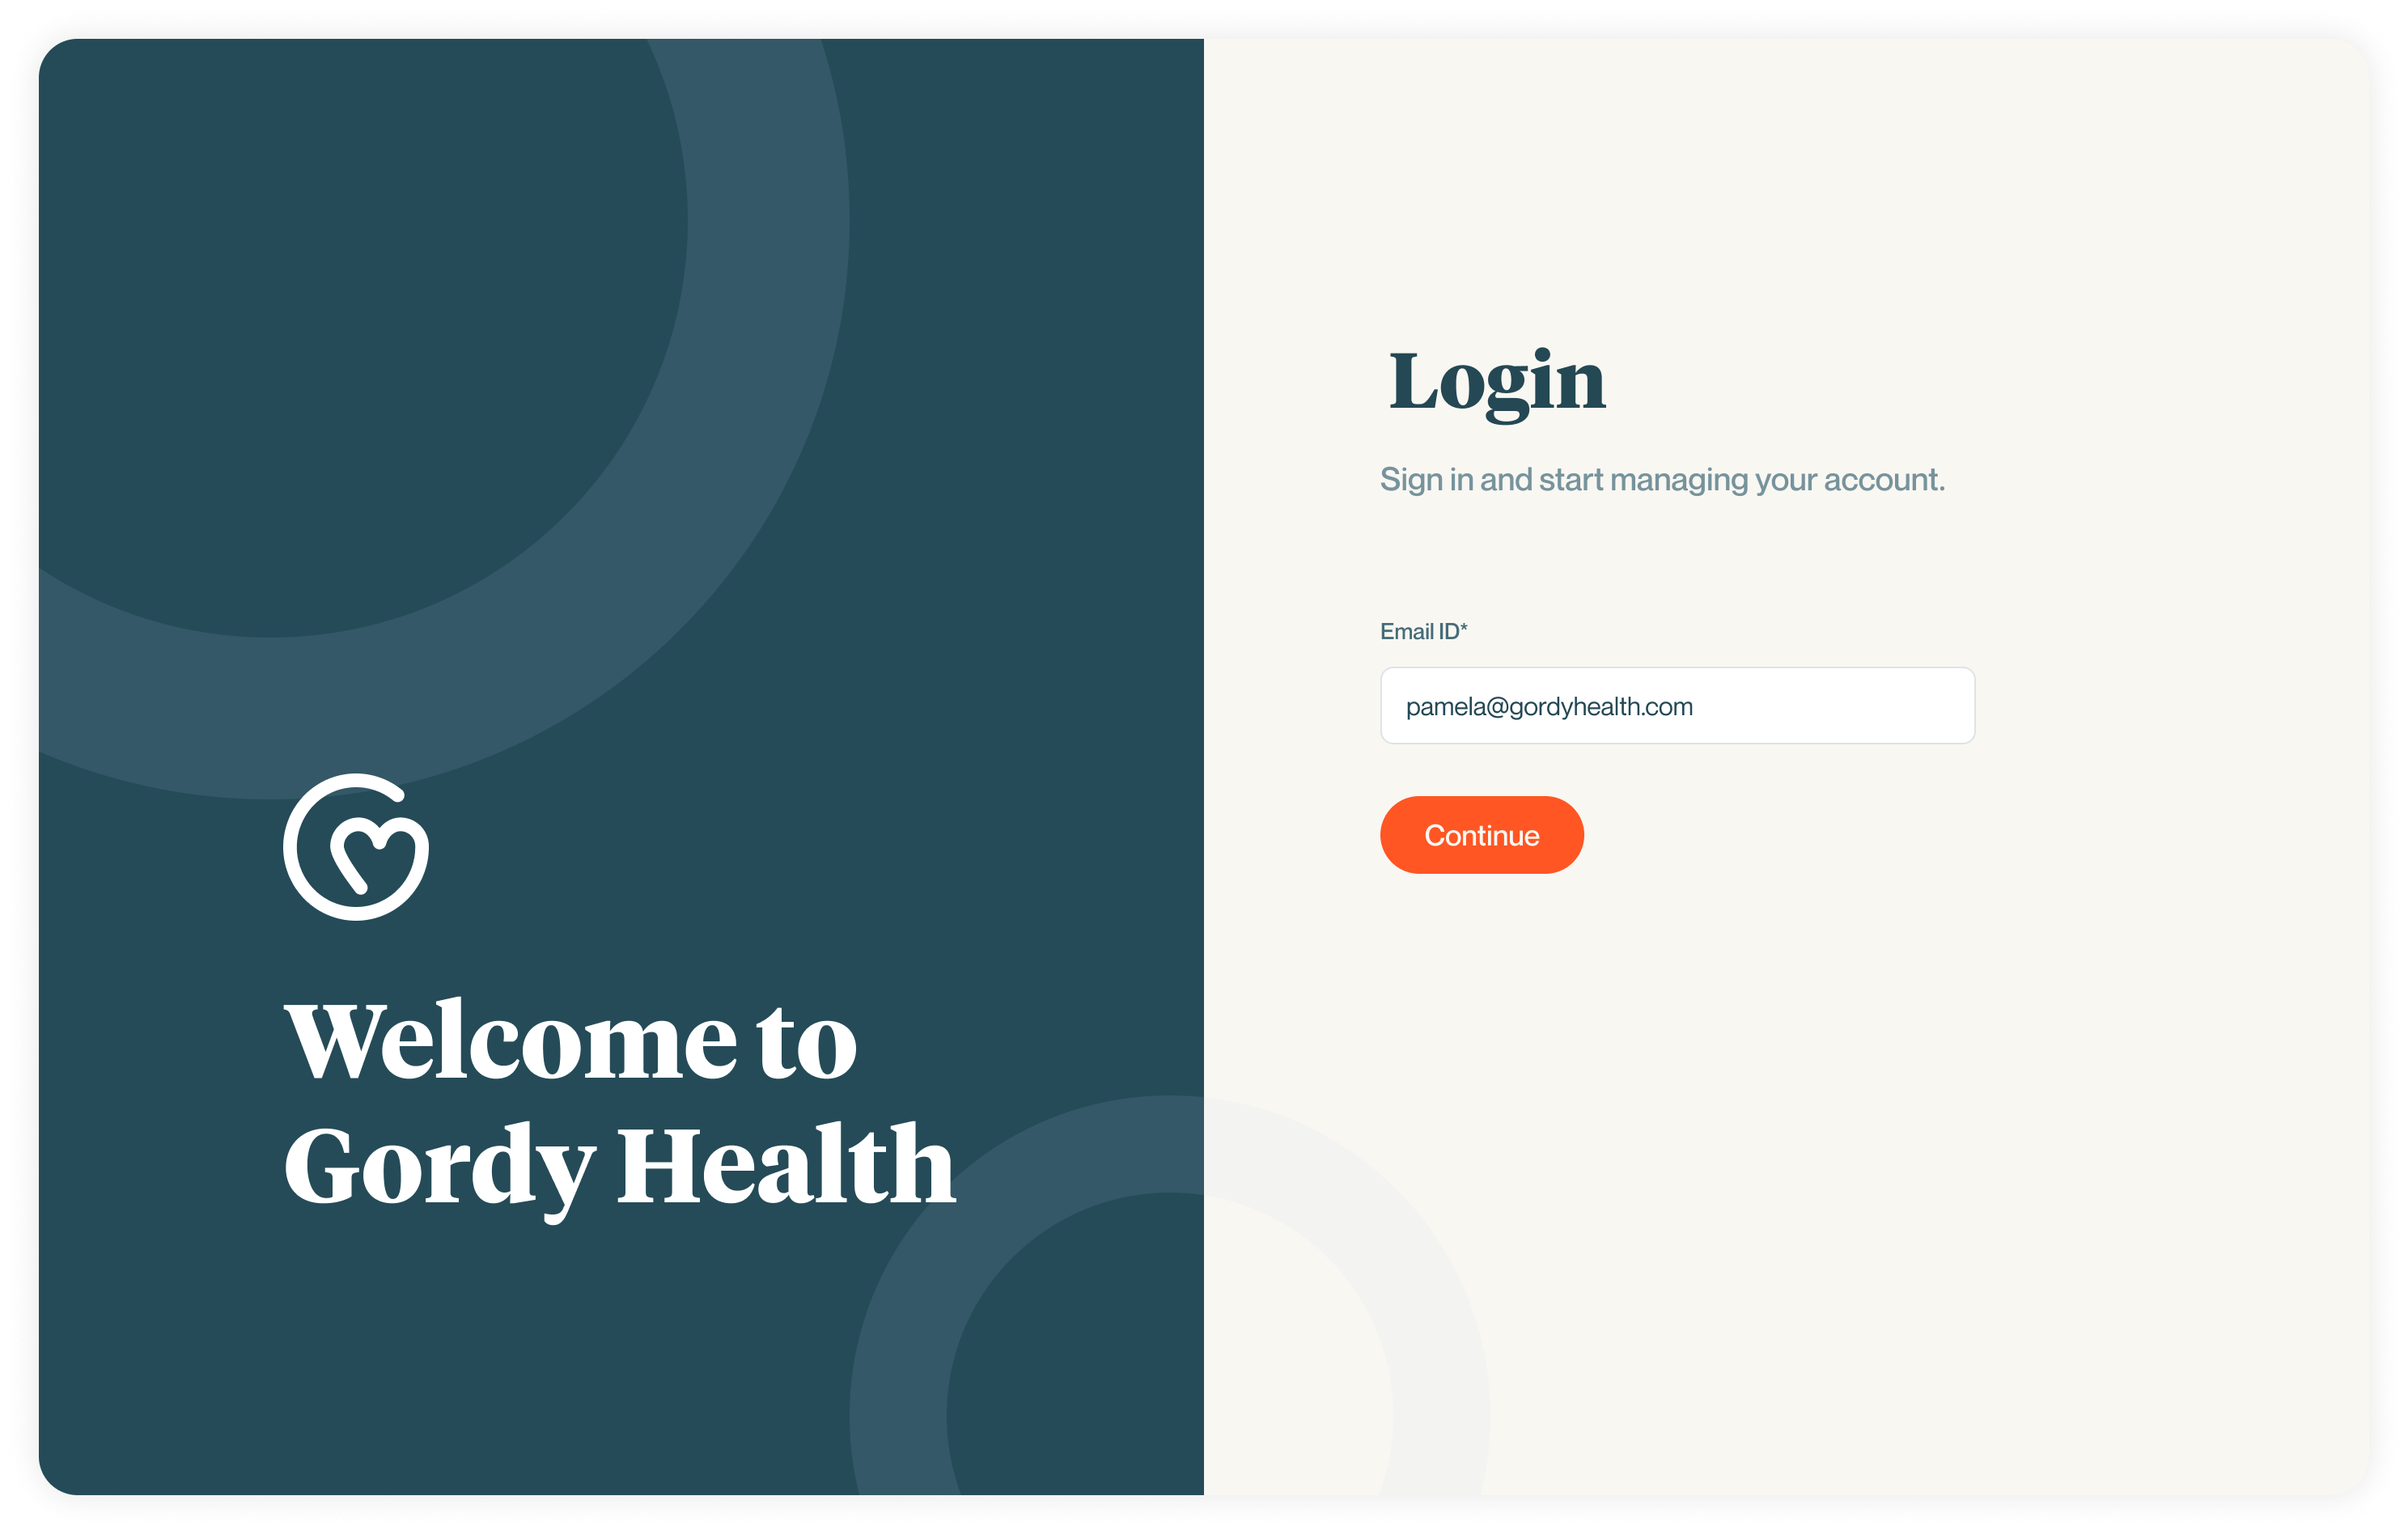
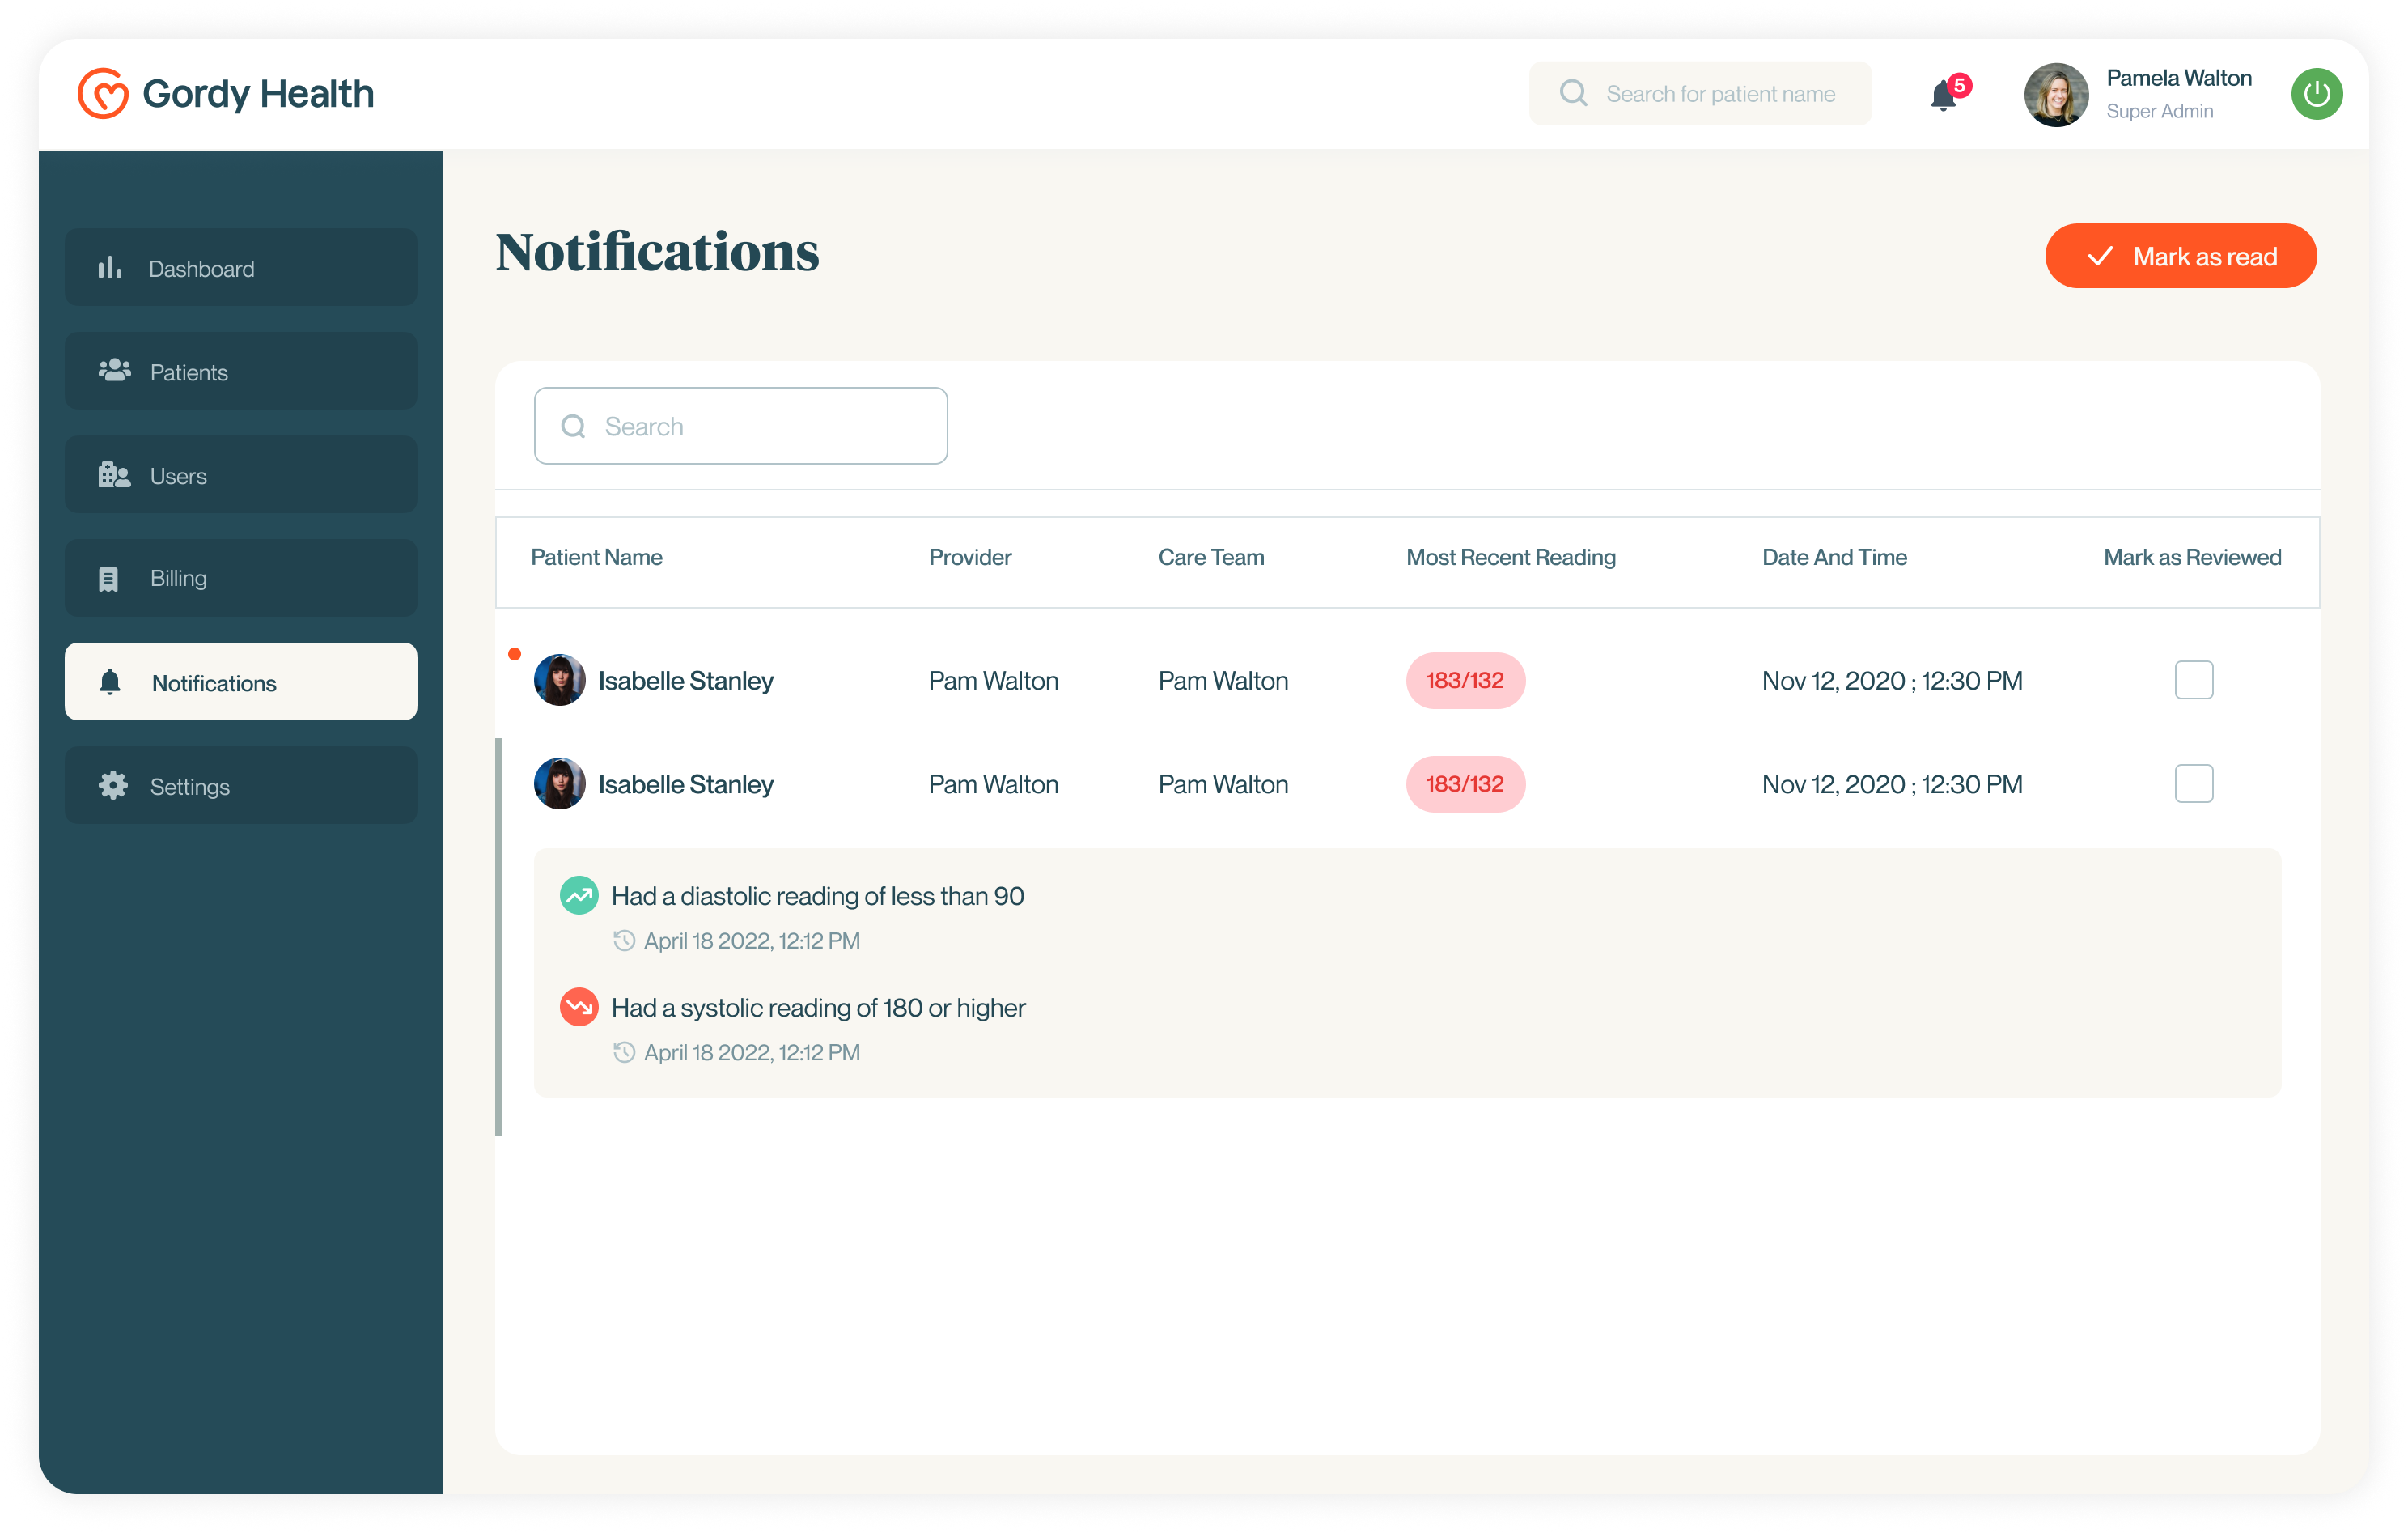
Ease of Use & Platform Stickiness

KPI - Session Timing

Manish Surapaneni

A Visionary & Expert in enhancing customer experience design, build solutions, modernize applications and leverage technology with Data Analytics to create real value.

Linkedin
Contact Us

Other articles

Stop Outsourcing Your Ethics, Tech Leaders

Manish Surapaneni

How to beat the tech talent squeeze in 2023_ 6 Proven Strategies

Manish Surapaneni

How Augmented human intellengence can enhance our lives with machines

Manish Surapaneni